Annual Complaints Review 2024-25
On this page
This page refers to Complaint Handling Failure Orders (CHFOs), which was our process at the time of publication. We now issue Complaint Handling Failure Notices (CHFNs) in these circumstances. View the latest information on how we bring landlords into compliance in casework.
Introduction
Our Annual Complaints Review looks at how our members are managing complaints.
We made 7,082 determinations – decisions following the investigation of a complaint - between 1 April 2024 and 31 March 2025. This is a 30% increase from 2023-24.
Findings
In 2024-25 we:
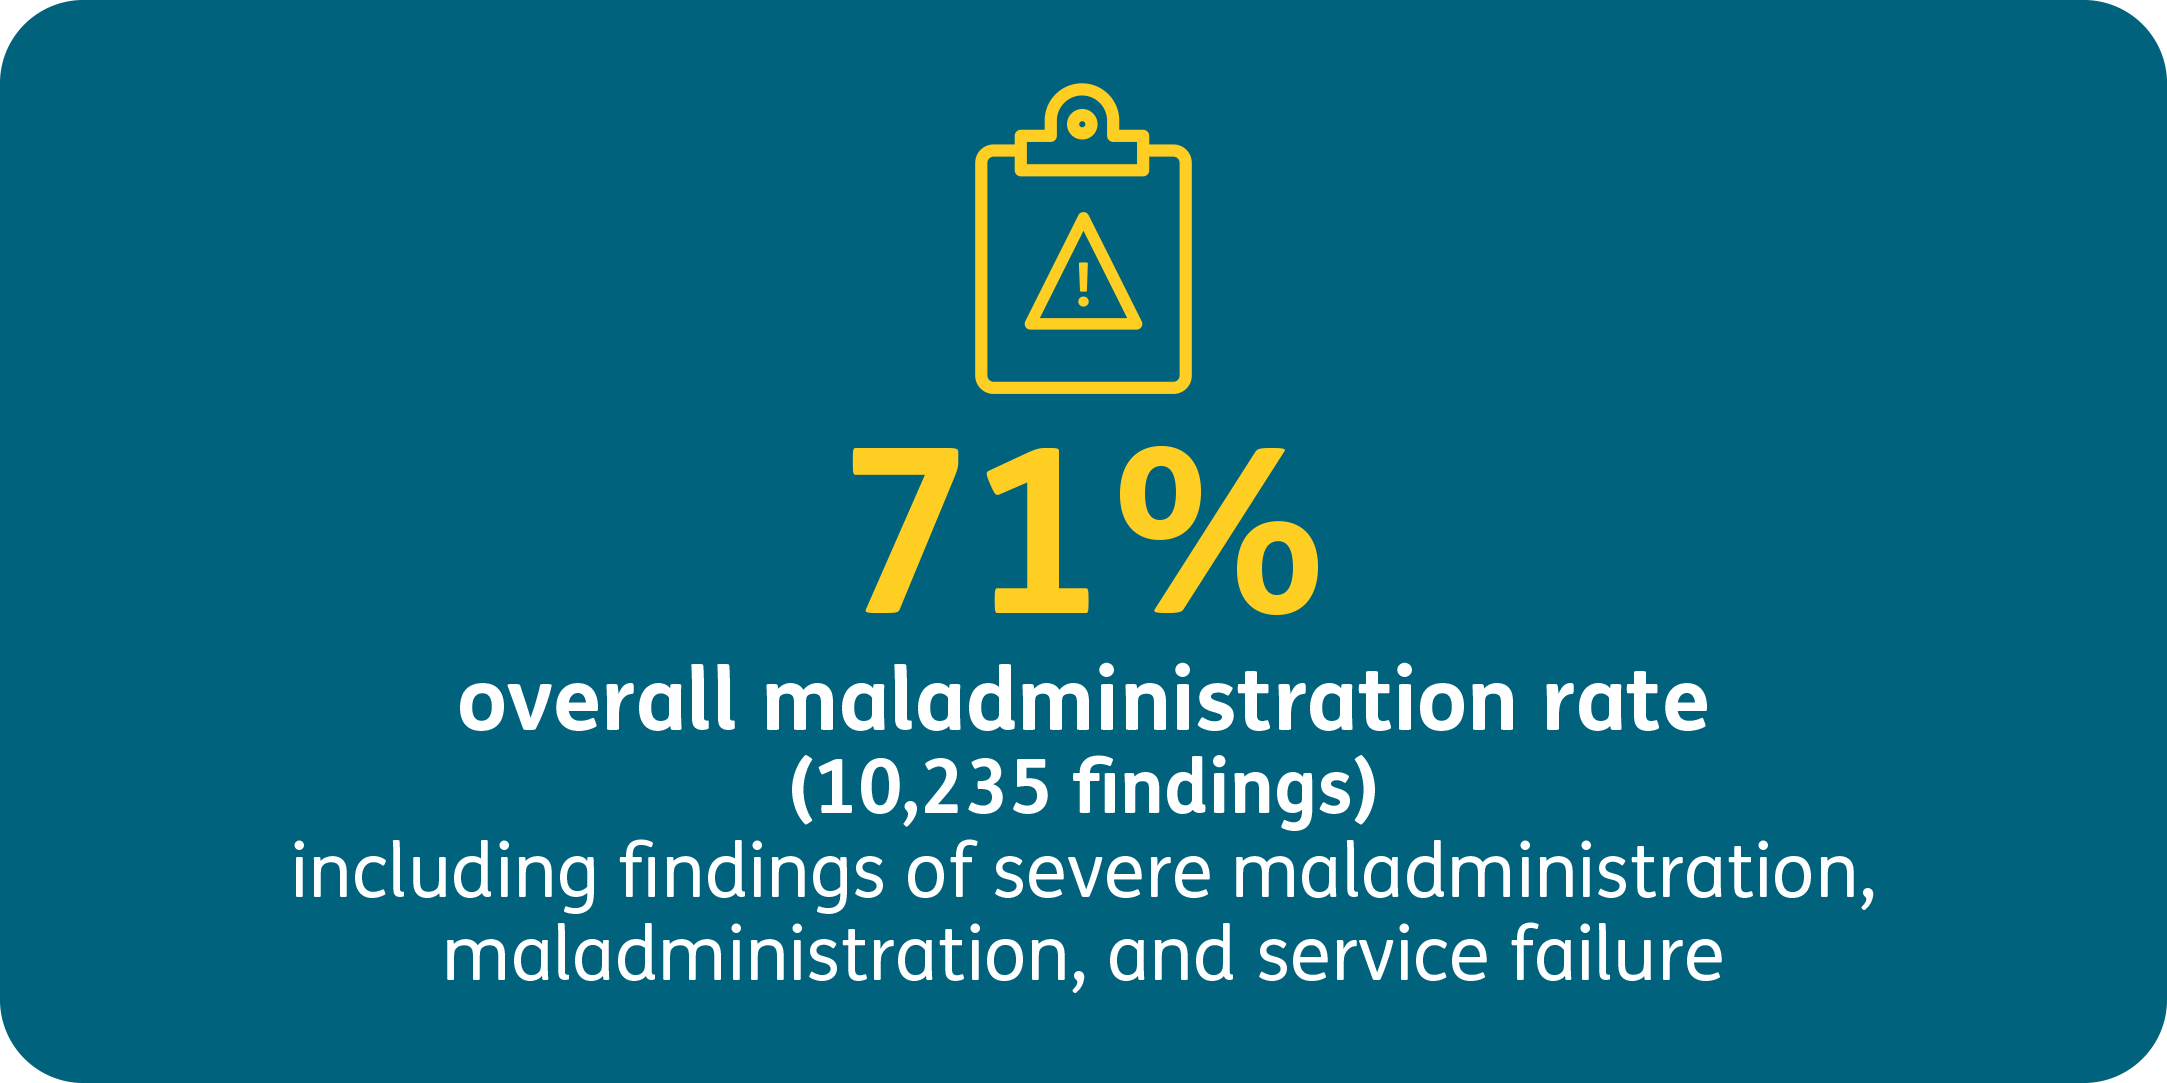
- upheld 71% of complaints
- found 120 landlords had a maladministration rate of over 75%, and 16 landlords improved significantly since last year
- made 2,007 findings of reasonable redress, over 800 more than last year
- issued a similar number of Complaint Handling Failure Orders as last year despite receiving more complaints
- investigated 43% more complaints about repairs
- investigated and upheld fewer complaints about Antisocial Behaviour (ASB)
- found that local authorities, as well as housing associations with between 1,000 and 10,000 homes, are struggling more than other landlords to provide timely responses to complaints
- started to see evidence of improvements in the complaint handling category, including a 7% drop in maladministration rate and 117 fewer severe maladministration findings
- made 26,901 interventions to put things right
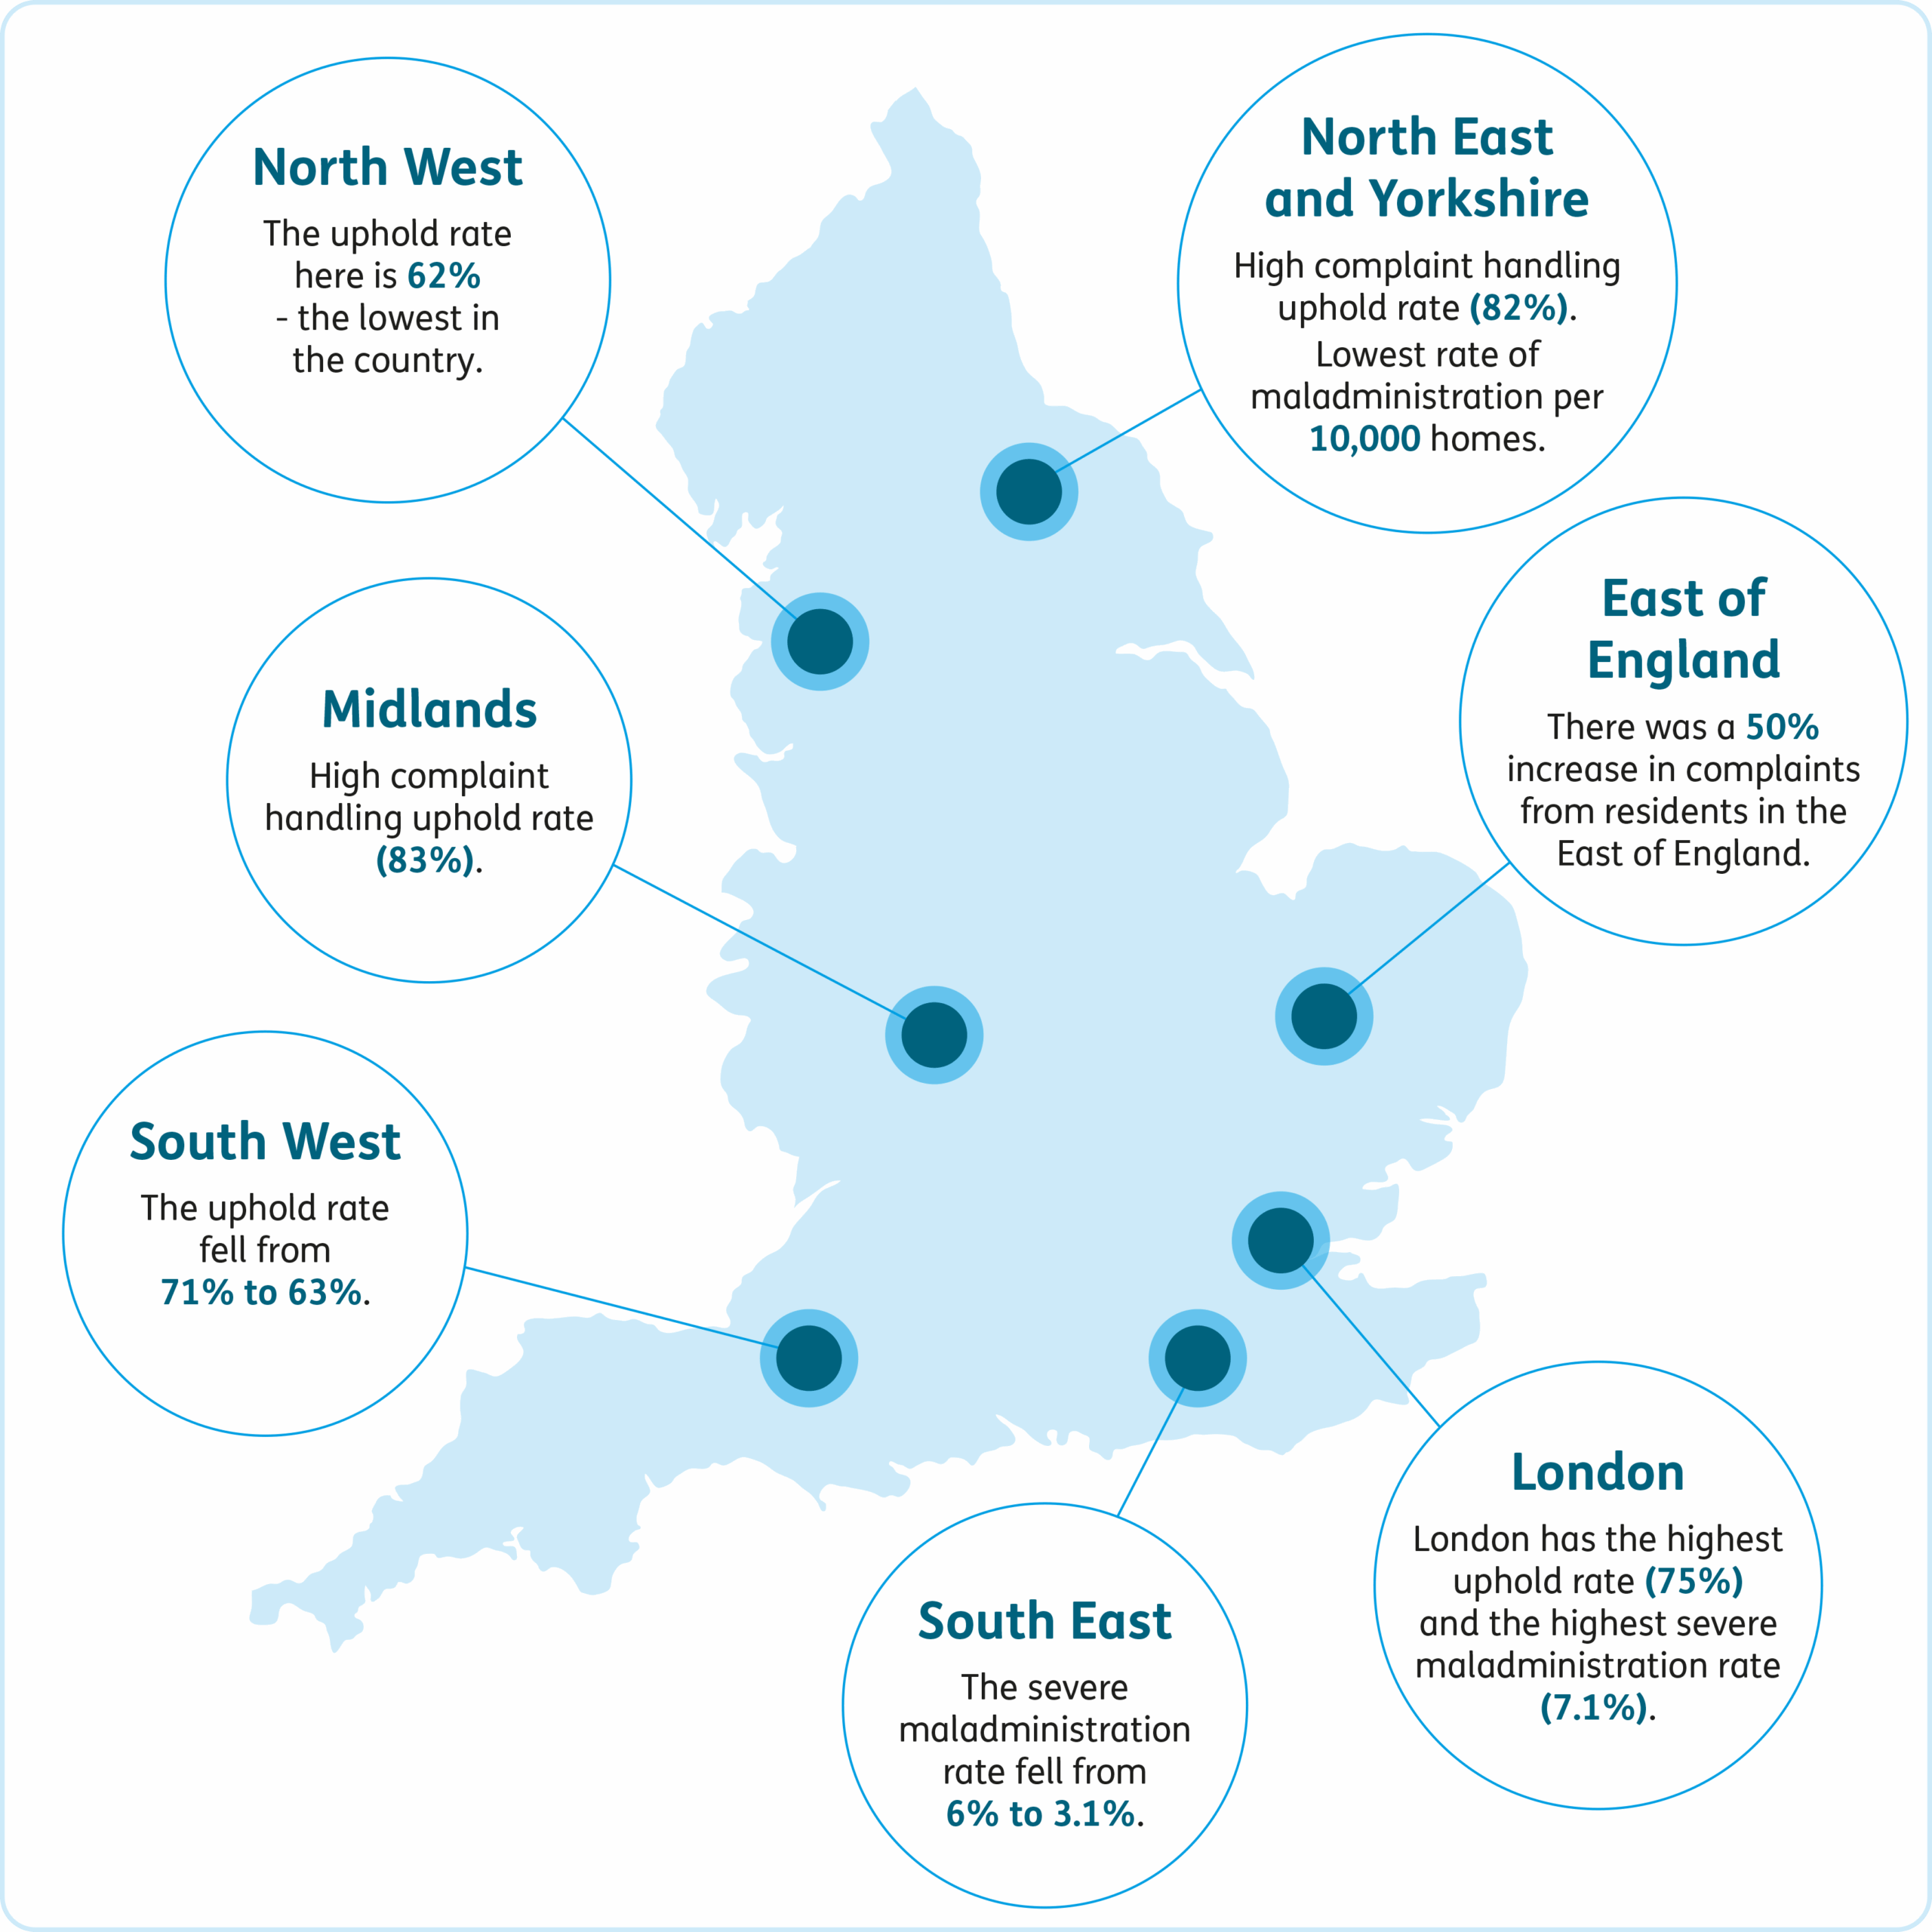
- found some regional variations, including:
- a high volume of ASB complaints in the North East and Yorkshire
- a 50% increase in complaints from the East of England
- the lowest uphold rate in the North West
![]() This year we have worked with Housemark to provide added insight and context to our data. Housemark analysed our data about their members alongside their own data and other publicly available information. Their findings are referred to throughout this report.
This year we have worked with Housemark to provide added insight and context to our data. Housemark analysed our data about their members alongside their own data and other publicly available information. Their findings are referred to throughout this report.
Helpful Links
- Landlord performance reports (Opens in a new tab)
- Guidance on landlord reports (pdf) ( pdf, 0.14 MB)
- Landlords with a maladministration rate of 75% or higher (Opens in a new tab)
- Letter to landlords with a maladministration rate of 75% or higher (pdf) ( pdf, 0.12 MB)
- Landlords with a 0% maladministration rate (Opens in a new tab)
- Letter to landlords with a 0% maladministration rate (pdf) ( pdf, 0.12 MB)
- Landlords with a substantially improved maladministration rate (Opens in a new tab)
- Letter to landlords with a substantially improved maladministration rate (pdf) ( pdf, 0.12 MB)
- Landlords with severe maladministration findings (Opens in a new tab)
- Landlords with more than 5 Complaint Handling Failure Orders (Opens in a new tab)
- Landlords with individual performance reports (xlsx) ( xlsx, 0.39 MB)
Overall sector performance
Our investigations decide whether a landlord is responsible for maladministration. When we decide a complaint, we make a finding. Our findings are:
- severe maladministration – the most serious failing
- maladministration – there was a failure which affected the resident
- service failure - there was a minor failing but action is still needed to put things right
- reasonable redress – there was a failure, but the landlord has put it right
- no maladministration – the landlord acted fairly and reasonably
- mediation – the complaint has been resolved with the Ombudsman’s help
Every day social landlords do vital work and resolve a range of service requests successfully. However, where things go wrong, we see consistent themes. These include cases where landlords:
- do not meet statutory requirements
- do not follow their own policies and procedures
- do not investigate hazards
- avoidably delay repairs
- overlook household circumstances, including disabilities and health needs
We often find these failings are compounded by poor communication, complaint handling, and record keeping.
Maladministration rate (or ‘uphold’ rate)
A complaint is upheld if we find severe maladministration, maladministration, or service failure. This may mean the landlord did not:
- carry out its legal obligations
- follow its own policy or process
- act fairly or reasonably
We upheld 71% of complaints in 2024-25. The rate reduced by 2 percentage points compared to 2023-24 but is still too high.
The Ombudsman decided complaints about 419 landlords in 2024-25. 16 landlords show significant improvement in the rate and number of upheld complaints compared to last year. However, 120 landlords had 75% or more of the complaints about them upheld.
Regulatory standards and upheld complaints
The Regulator of Social Housing (the Regulator) inspects landlords to find out how well they are providing the outcomes of the regulatory standards. The consumer standards concentrate on the provision of housing services, including complaints. Housemark found that landlords given the highest consumer grading (‘C1’) have lower uphold rates and lower compensation orders. This suggests a link between good complaint handling and good overall performance.
Landlord type
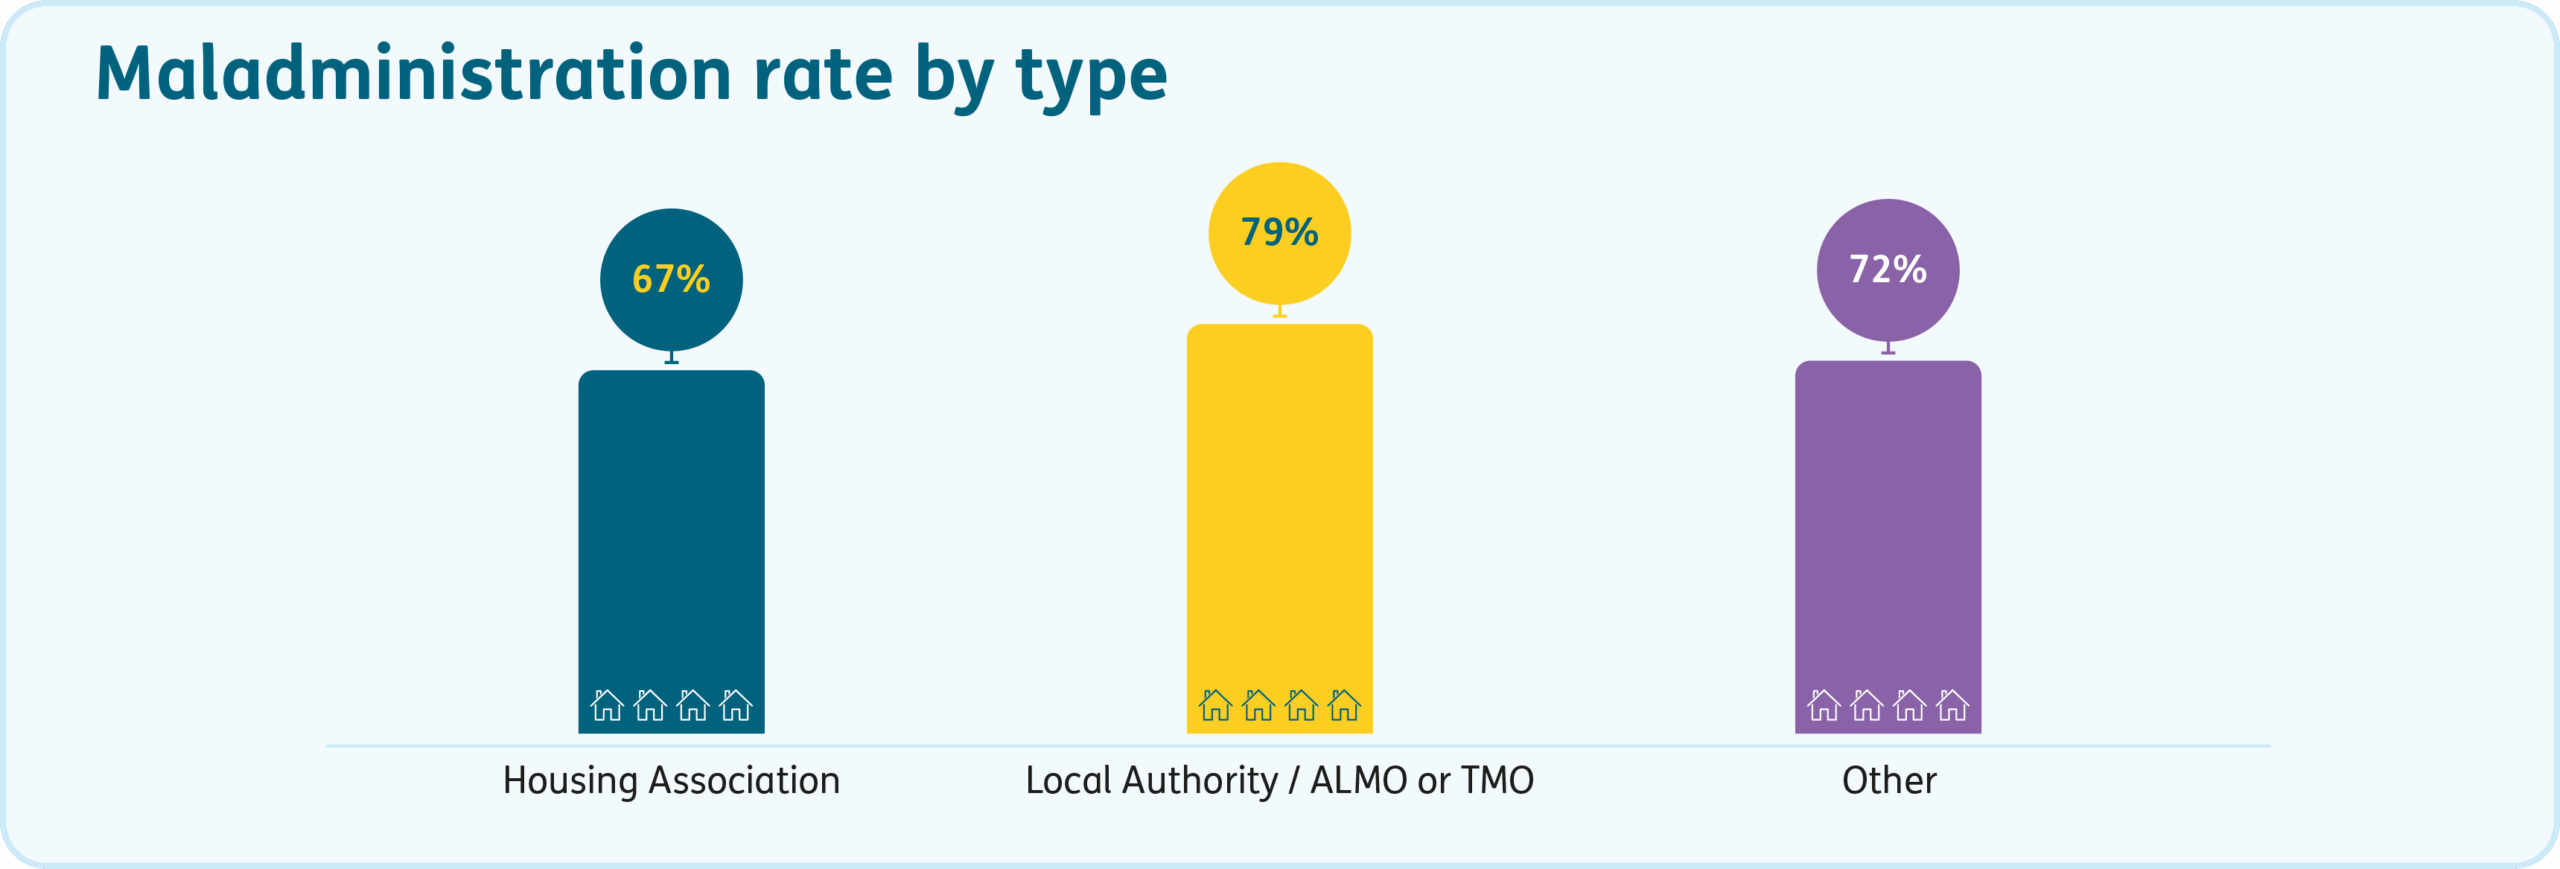
30% of the complaints we decided in 2024-25 were about local authorities. We upheld a greater proportion of complaints about local authorities compared to housing associations and other types of landlords.
We upheld 87% of disputes about local authorities’ complaint handling. This is higher than housing associations (73%). Housemark analysis suggests local authorities typically report weaker performance on complaints responded to within timescale than housing associations.
This is also shown by other measures. For example, the Local Government and Social Care Ombudsman reported an 18% increase in incoming housing complaints and upheld 85% of housing-related complaints in 2024-25. Local authorities also account for 31 of the Regulator’s 36 ‘C3’ consumer gradings, and the only ‘C4’ gradings issued to date.
Local authorities provide a much broader range of services than just housing. This may impact the complaint handling resources available for housing complaints. However, every available measure suggests that there are challenges with local authority housing complaint handling. This is a priority for local authority leaders.
While housing associations perform better on complaint handling overall, we also found 20 housing association landlords with a complaint handling uphold rate at, or above, the average for local authorities. Leaders of those landlords, all of which received individual performance reports, should focus on improving complaint handling and outcomes for residents.
We’ll continue to provide insight wherever possible through our systemic work and our Centre for Learning.
Severe maladministration
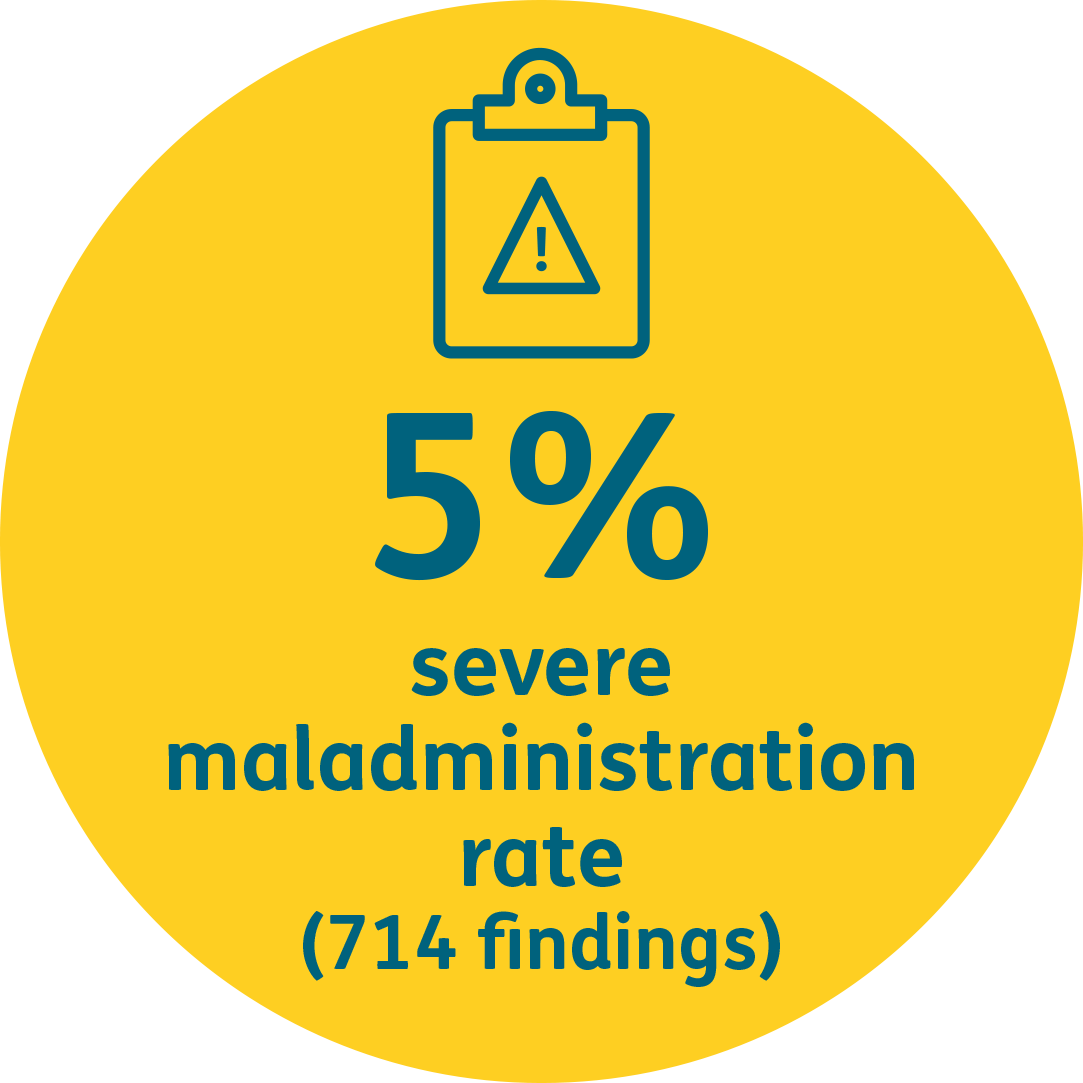
The most serious failings will result in a finding of severe maladministration. We made 714 findings of severe maladministration in 2024-25. This is a 2 percentage point decrease in the proportion of maladministration findings overall.
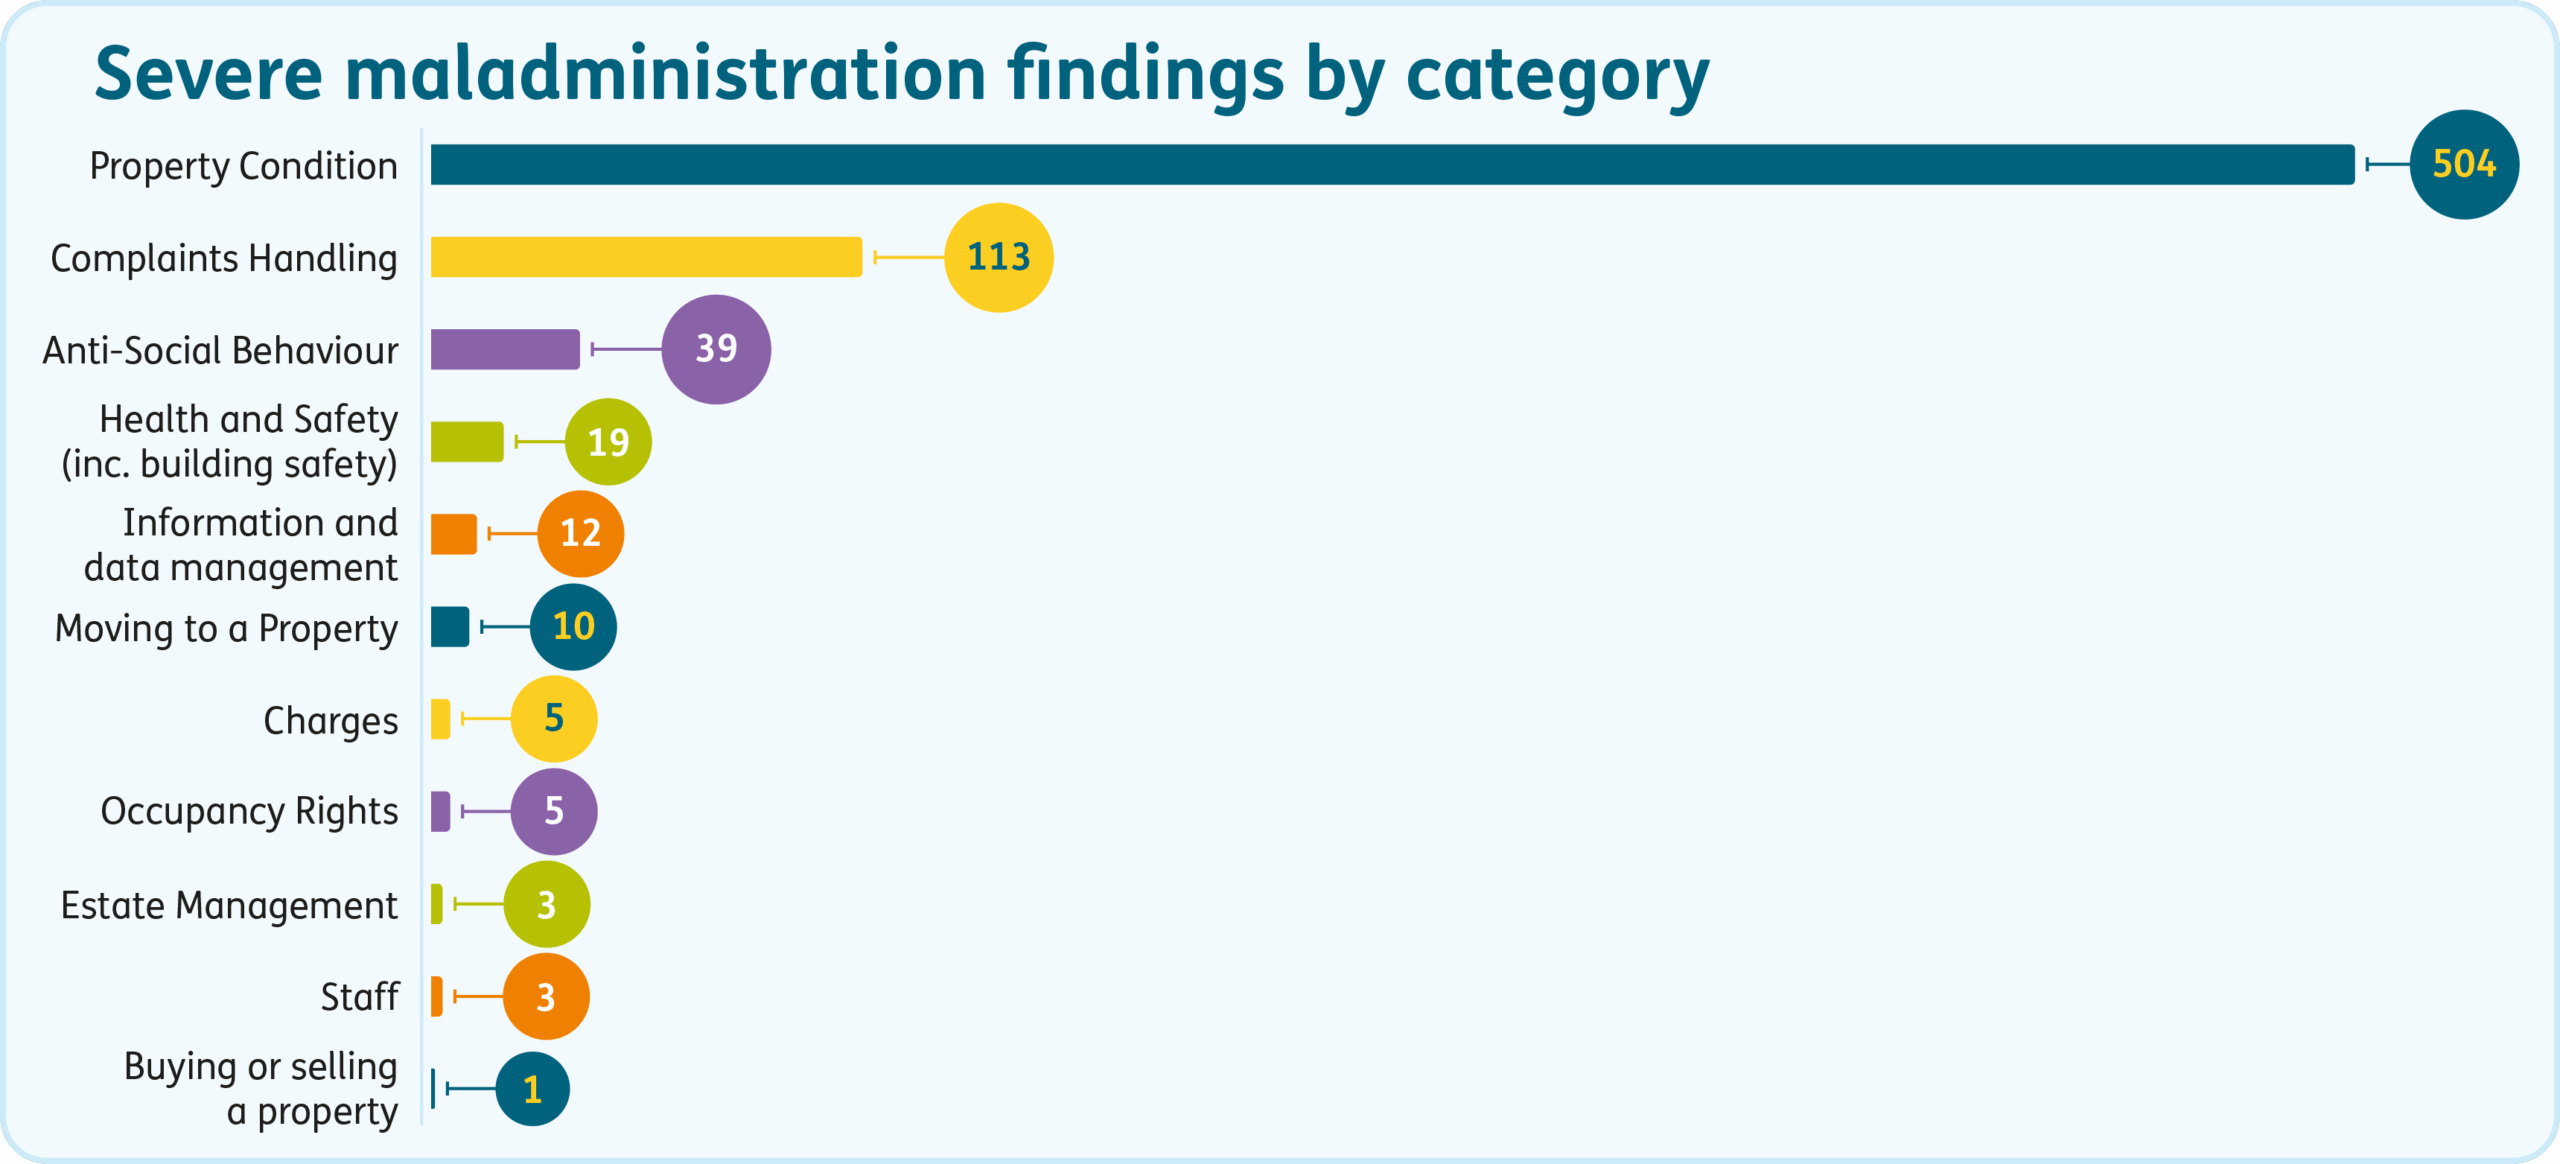
We found more severe maladministration in landlords’ handling of complaints about property condition than any other category, and more than in 2023-24.
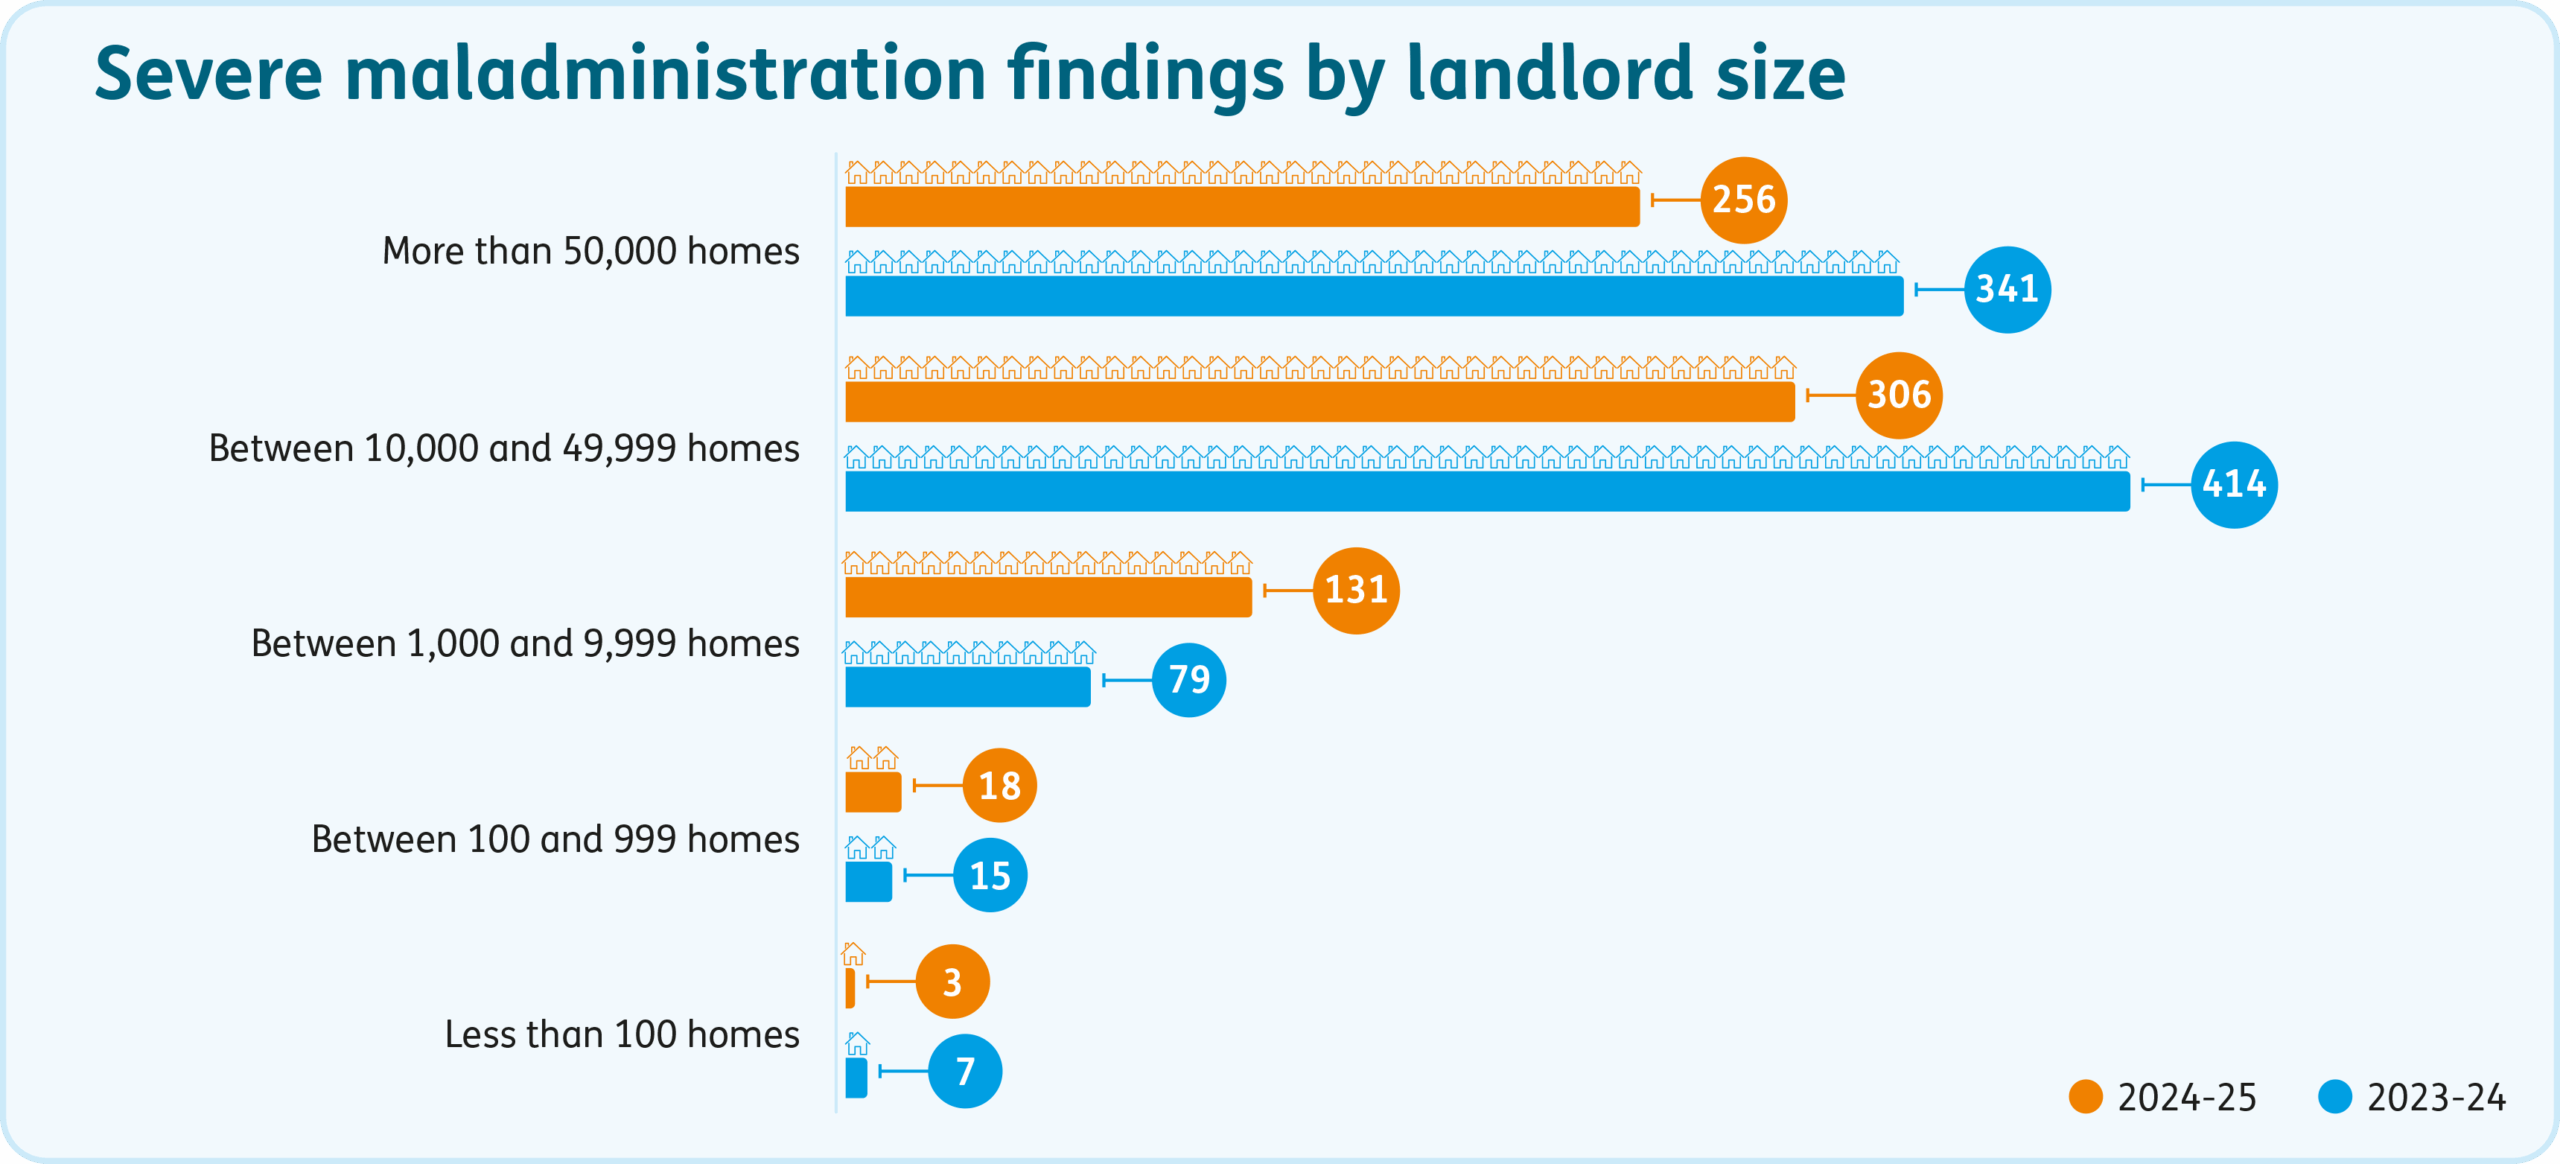
Landlords with more than 10,000 homes received almost 4 in every 5 of the severe maladministration findings we made in 2024-25.
Housemark used slightly different size bands to ours. They found that larger landlords, particularly those with over 20,000 homes, received larger compensation orders and reported lower resident satisfaction levels.
There was an increase in the number and proportion of severe maladministration findings in complaints about landlords with between 1,000 and 9,999 homes. These landlords were, perhaps, better able to provide services than larger organisations in recent years. This could now be more difficult in light of increasing operational and economic pressures.
This may lead to lower satisfaction levels and more complaints upheld by us. However, despite the complaint handling problems referred to earlier in this report, local authorities were only slightly more likely than housing associations to receive a finding of severe maladministration.
We publish details of our severe maladministration findings throughout the year which pull out important learning and include learning statements from landlords.
No maladministration and reasonable redress
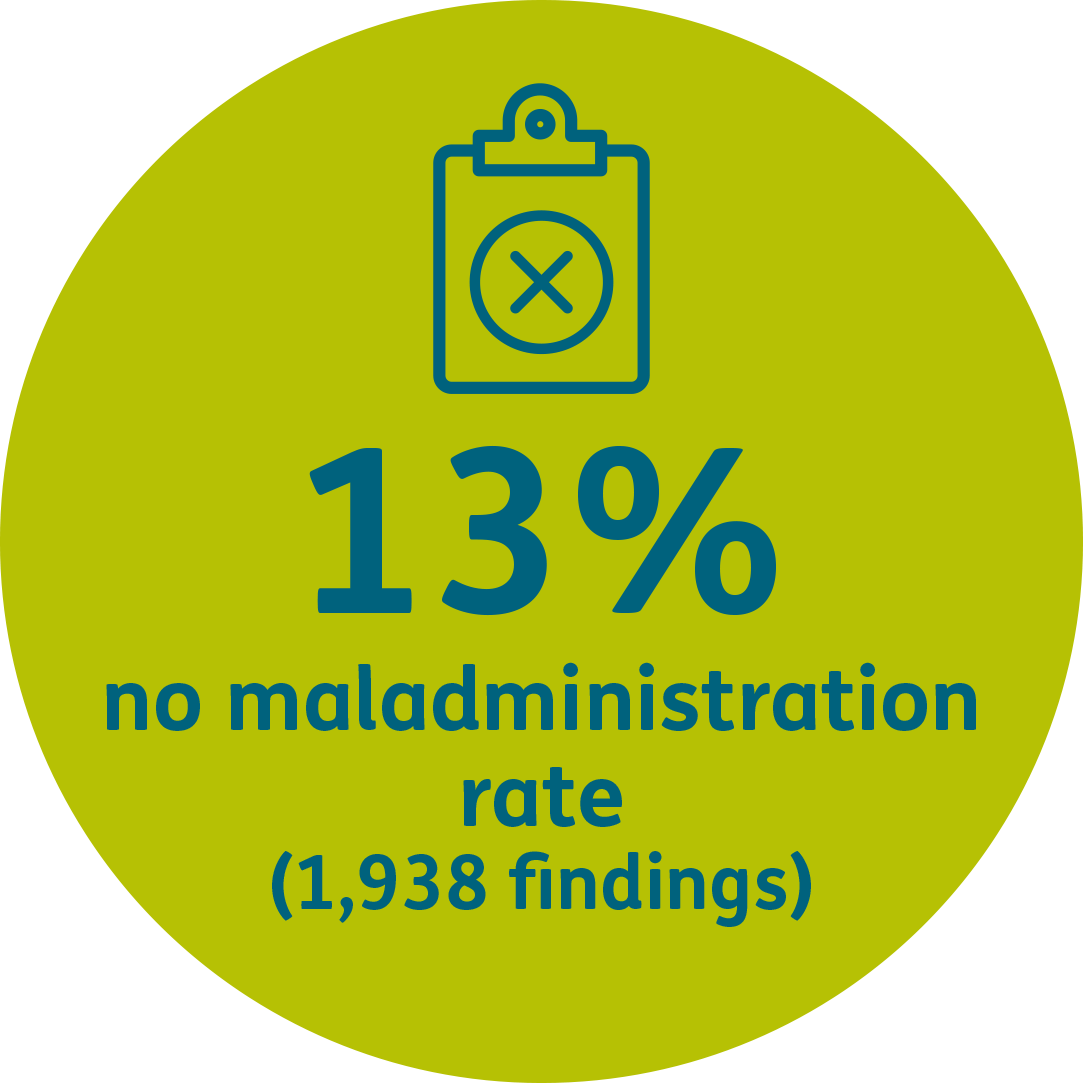
Our investigation may find no maladministration by the landlord. The overall number of no maladministration findings increased slightly, although the proportion fell from 15% to 13%.
Our investigation may also find that there was some maladministration, but the landlord fairly and reasonably put things right using its complaints procedure. In these cases, we say there has been “reasonable redress”.
In 2024-25 we saw an increase in the proportion of reasonable redress findings (13%, up from 10% in 2023-24). This was particularly seen in complaint handling disputes. This suggests landlords are getting better at recovering service failings, even if services still need to improve.
Compensation was part of the landlord’s offer in 4 out of every 5 reasonable redress decisions. However, in half of the reasonable redress cases, other remedies were used alongside or instead of compensation. Most of these were case-specific actions such as providing better explanations for decisions or helping residents to access other services.
We’ll continue to publicise findings of no maladministration and reasonable redress on social media, in our Insight reports, and through our Centre for Learning to showcase how all landlords can resolve complaints positively.
Complaint Handling Failure Orders (CHFOs)
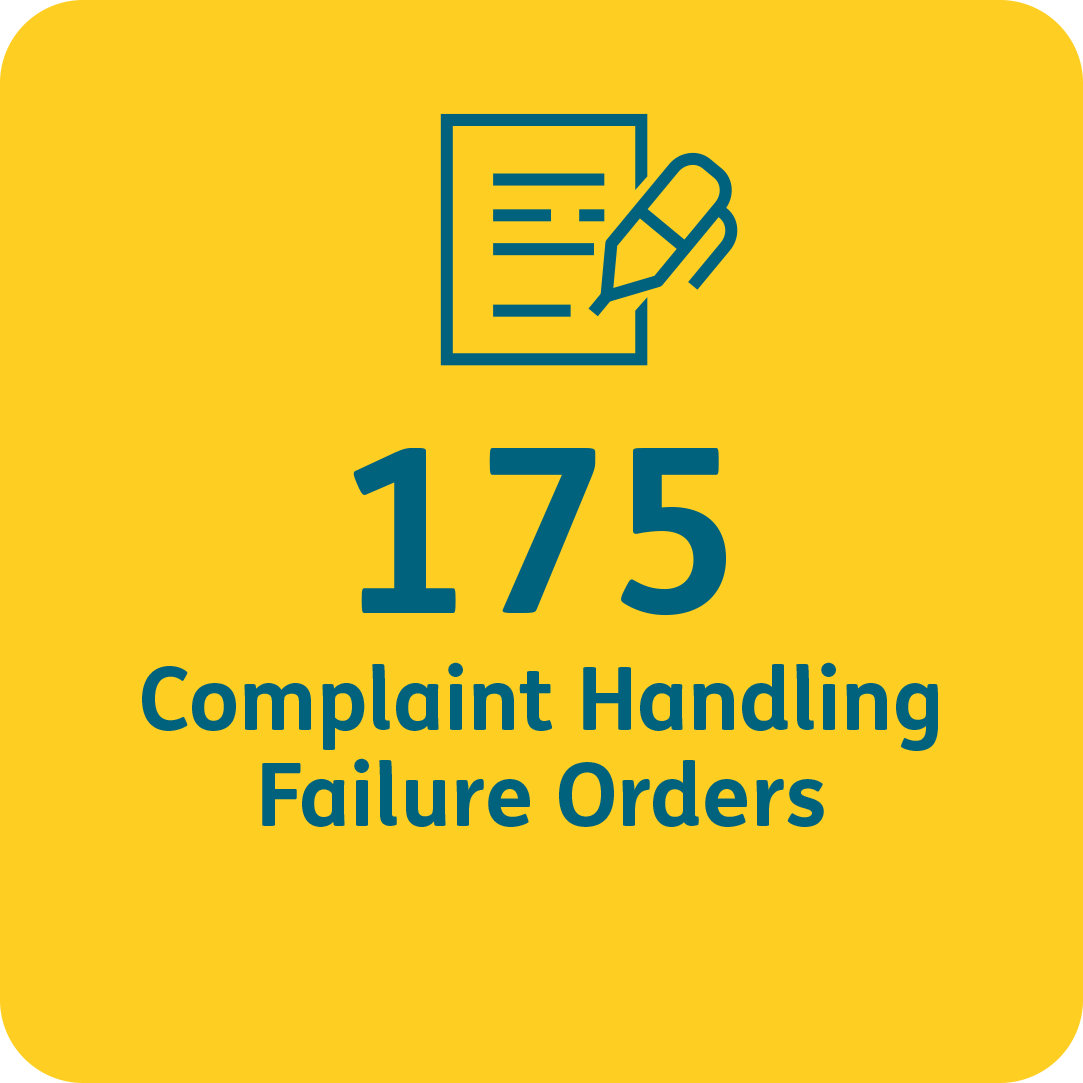
In 2024-25 we issued 175 Complaint Handling Failure Orders (CHFOs). These are issued where a landlord fails to comply with the Complaint Handling Code (the Code). These are issued when:
- a landlord unreasonably delays in accepting or progressing a complaint through its process
- a landlord unreasonably delays in providing complaint information requested by us
- a landlord fails to provide evidence of compliance with orders made in determinations
In 8 cases we issued multiple CHFOs because of more than one such failure by the landlord.
The number of CHFOs issued in 2024-25 is similar to the previous year, despite an increase in the number of complaints we received. This, and the reduction in upheld disputes about complaint handling, are signs of improved local complaint handling. We are cautiously optimistic that the Code is starting to embed in landlords’ operations.
Housemark analysis shows that being issued a CHFO can indicate other issues. These include fewer stage 1 complaints responded to in target, lower complaint volumes, and higher compensation orders from us.
There is also evidence that higher-performing landlords receive more stage 1 complaints than others but, crucially, a greater proportion are resolved locally and do not need to go any further. This reinforces the message that complaints are important to providing excellent services and, if managed effectively, can lead to better all-round performance.
3 out of every 5 CHFOs were issued to local authority landlords, reinforcing our findings that local authorities may struggle to respond to complaints on time more than other types of landlord.
There were 9 landlords which received more than 5 CHFOs 6 were local authorities. One housing association and 3 local authorities had also received more than 5 CHFOs in 2023-24.
CHFOs give a real time indicator of how a landlord’s complaints policy is working. Landlords should reflect on these and consider future improvements.
Top 3 categories
Categories
Every case we decide includes at least one complaint, and many include more than one. When we decide a complaint, we make a finding. We record the category of each finding we make.
We made 14,420 findings in 2024-25.
This excludes complaints which were either decided outside of our remit or withdrawn by the resident before we were able to investigate. In previous years the chart below has included counts of such complaints. This year we have removed them from the numbers in the chart below. This is because we did not investigate those matters and therefore made no findings about them.
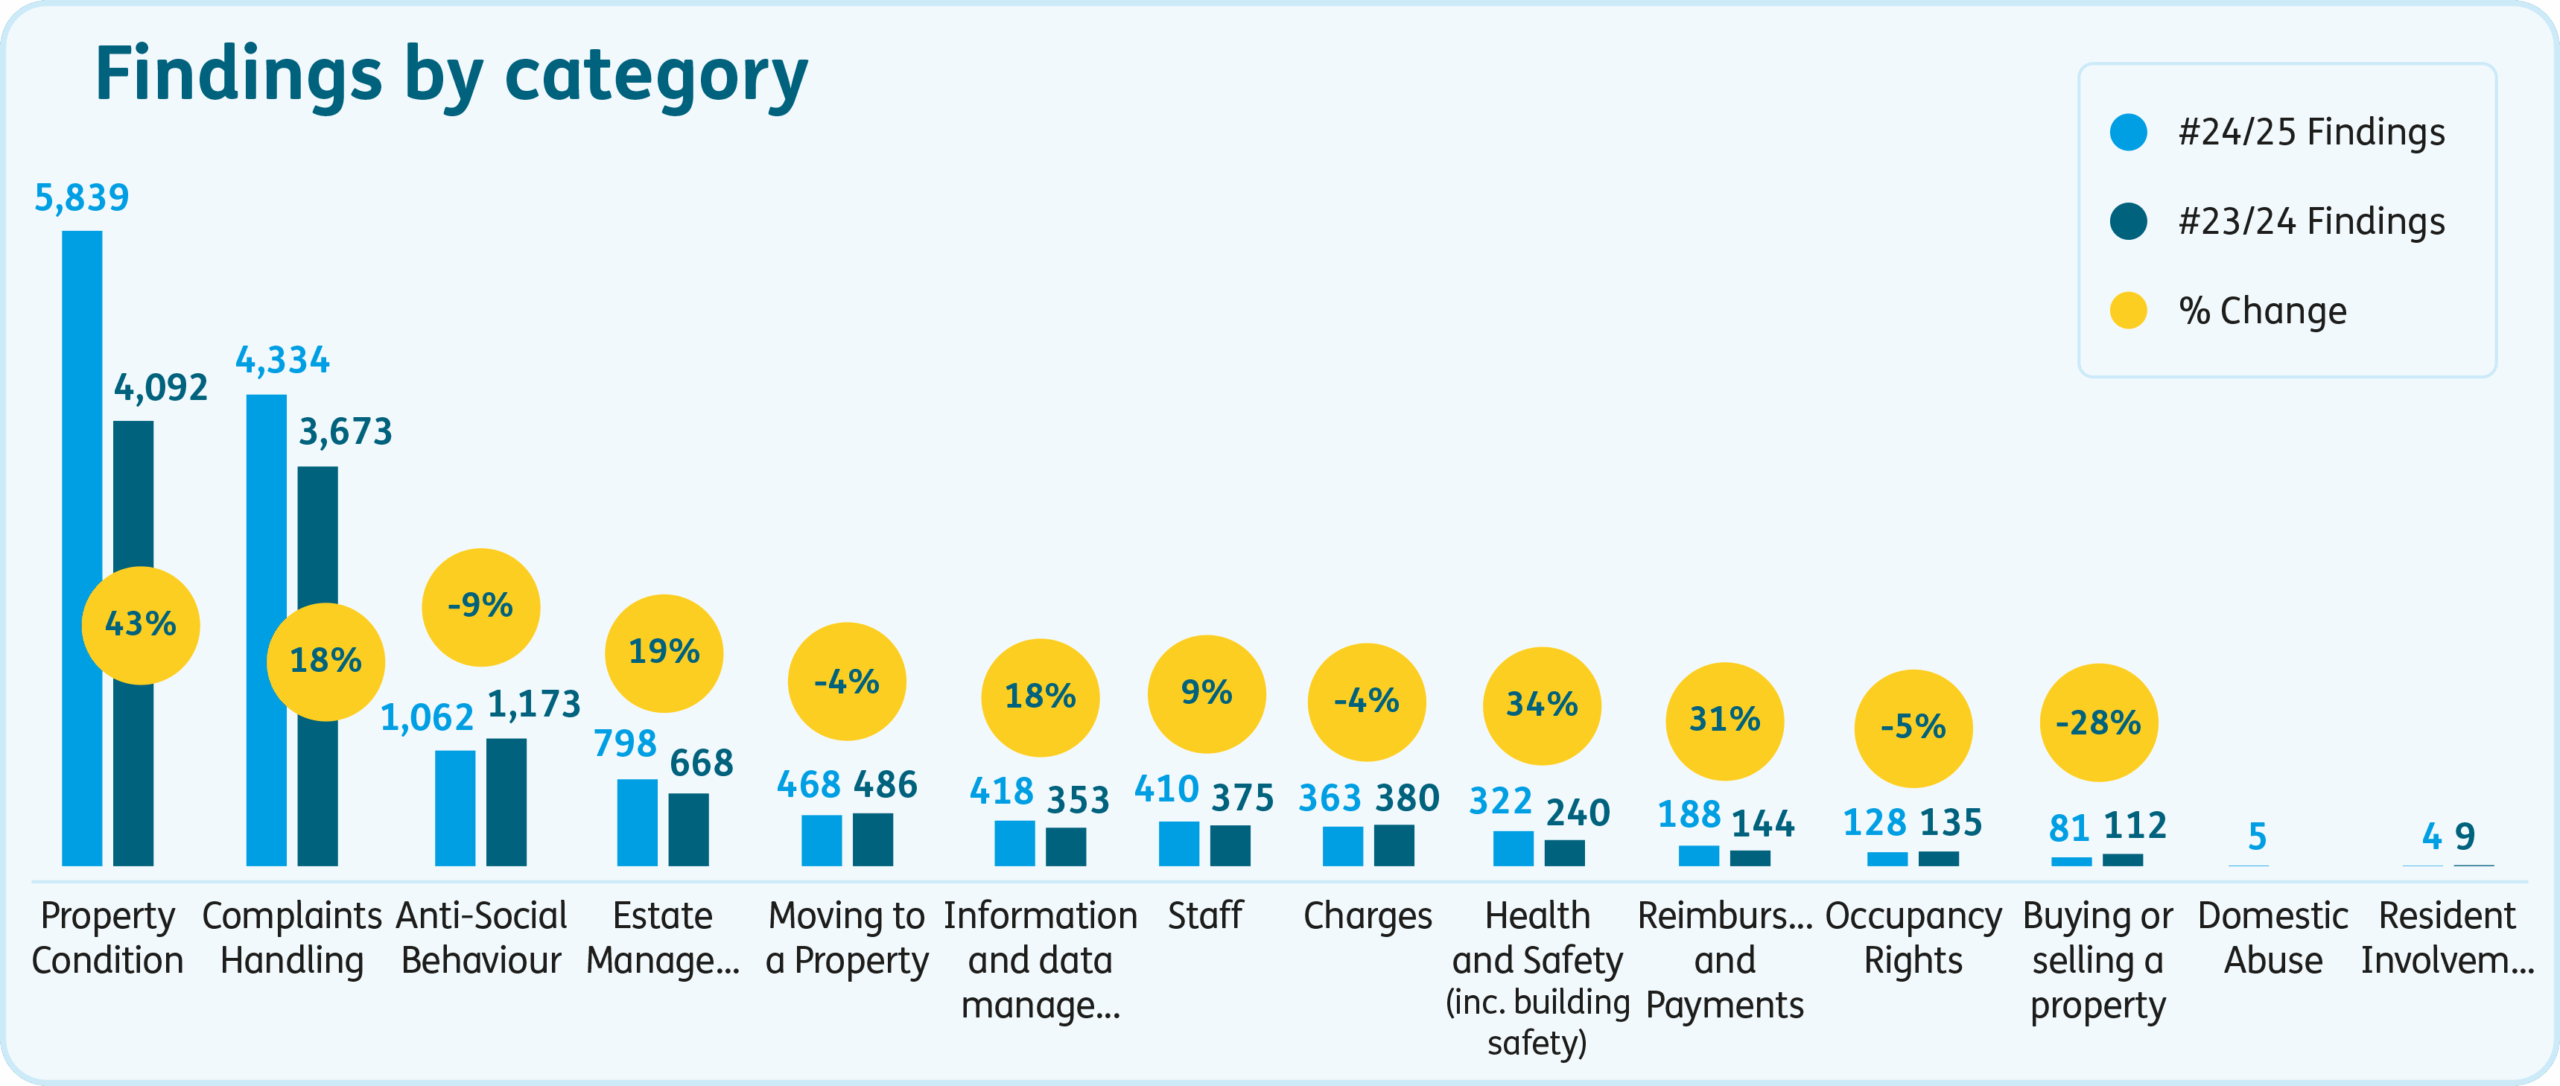
Property condition is still the most common complaint category, followed by complaint handling, and antisocial behaviour.
Top 3 categories
-
Property condition (repairs)
Repairs complaints are increasing
The increase in repairs complaints we decided on is disproportionately larger than the 30% increase in the number of decisions made. This is driven by increases in complaints about leaks, damp and mould, and about heating and hot water problems. We upheld complaints about repairs at the same rate as the year previous (73%).
There was a similar increase in the proportion of complaints about repairs in communal areas, which are part of the estate management category in the chart above.
The rising number of findings about property condition tells us that residents are more aware than ever about their rights to redress and the condition of home they can expect.
Behind every repair is a resident who wants to receive a high quality, prompt repairs service. When the most serious failings occur, residents can experience excessive delays, indifferent communication, or neglect for their circumstances.
Our Centre for Learning includes resources to help landlords improve their handling of complaints about leaks, damp and mould, and about heating and hot water problems.
Risk
An increasing proportion (45%) of high-risk cases involved repairs. This means we believe there is a significant risk to the resident caused by the severity of the issues, the length of time a repair has been outstanding, the resident’s personal circumstances, or a combination of multiple factors.
This suggests that responding fairly to residents’ complaints about living with disrepair, damp and mould continues to prove challenging for landlords and poses risks to residents’ wellbeing. We also saw a notable increase in investigations about health and safety concerns, particularly relating to asbestos.
From October 2025, landlords must address serious damp and mould hazards and emergency repairs within fixed timescales. Landlords must prioritise preparations for this and the other provisions of Awaab’s Law which will come into force over the coming years. Managing this alongside routine repairs and maintenance will be a challenge that landlords must embrace.
Improving repairs complaint handling
In 2024-25 we saw a slight increase in the proportion of reasonable redress findings in repairs complaints. It is important to say that this was mirrored by a slight decrease in findings of no maladministration. This tells us that while things are going wrong more often, they are also being put right more often.
We know landlords want to provide prompt and effective repairs and maintenance services, and we know there are significant challenges. Repairing trust in these services will take more investment, improvements in systems and technology, and excellent contract and performance management.
Our Spotlight report on repairs and maintenance provides learning and guidance to help landlords avoid further complaints. We’ll continue to publish casework examples and analysis to help landlords learn from complaints.
-
Complaint handling
Complaint handling maladministration findings fell from 84% in 2023-24 to 77% in 2024-25. This was matched by an increase in findings of reasonable redress.
We also saw a steep drop in the number of findings of severe maladministration in disputes about complaint handling. We made 113 such findings in 2024-25, down from 230 in 2023-24, despite the increase in the number of decisions. This suggests that landlords are more aware of and responsive to shortcomings in their complaint handling. There is more work for landlords to do in order to improve the complaint handling uphold rate. However, these findings are early signs that the Code is starting to embed across the sector.
We also saw notable increases in investigations about refunds of costs incurred by residents. A significant proportion of these resulted in findings of no maladministration or reasonable redress. Proper assessment of quantifiable financial loss is an important part of complaint handling and should be included in landlords’ remedies policies or guidance.
Our findings are encouraging, and we urge landlords to continue to carefully consider whether residents are out of pocket because of service failures.
-
Antisocial Behaviour (ASB)
We saw a similar shift in antisocial behaviour complaints although to a much smaller degree. We decided 1,062 complaints relating to ASB compared to 1,173 during 2023-24. We upheld 66% of these, down from 68% in 2023-24.
The most significant reduction in maladministration findings related to cases about personal ASB, including instances of verbal abuse, nuisance phone calls, and threatening behaviour. ASB is an extremely challenging area for landlords. Our Centre for Learning ASB resources can help members improve in providing this crucial service.
Remedies
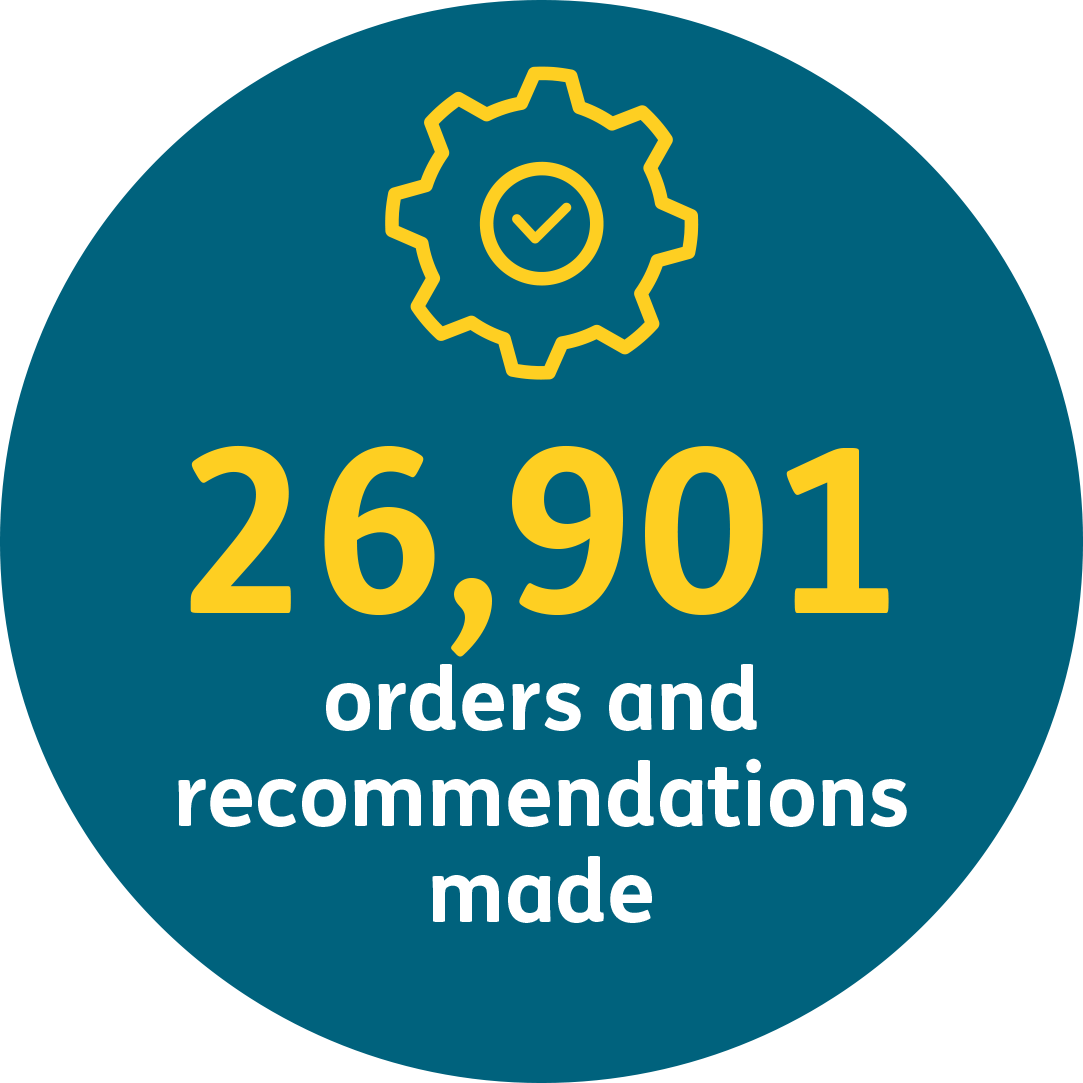
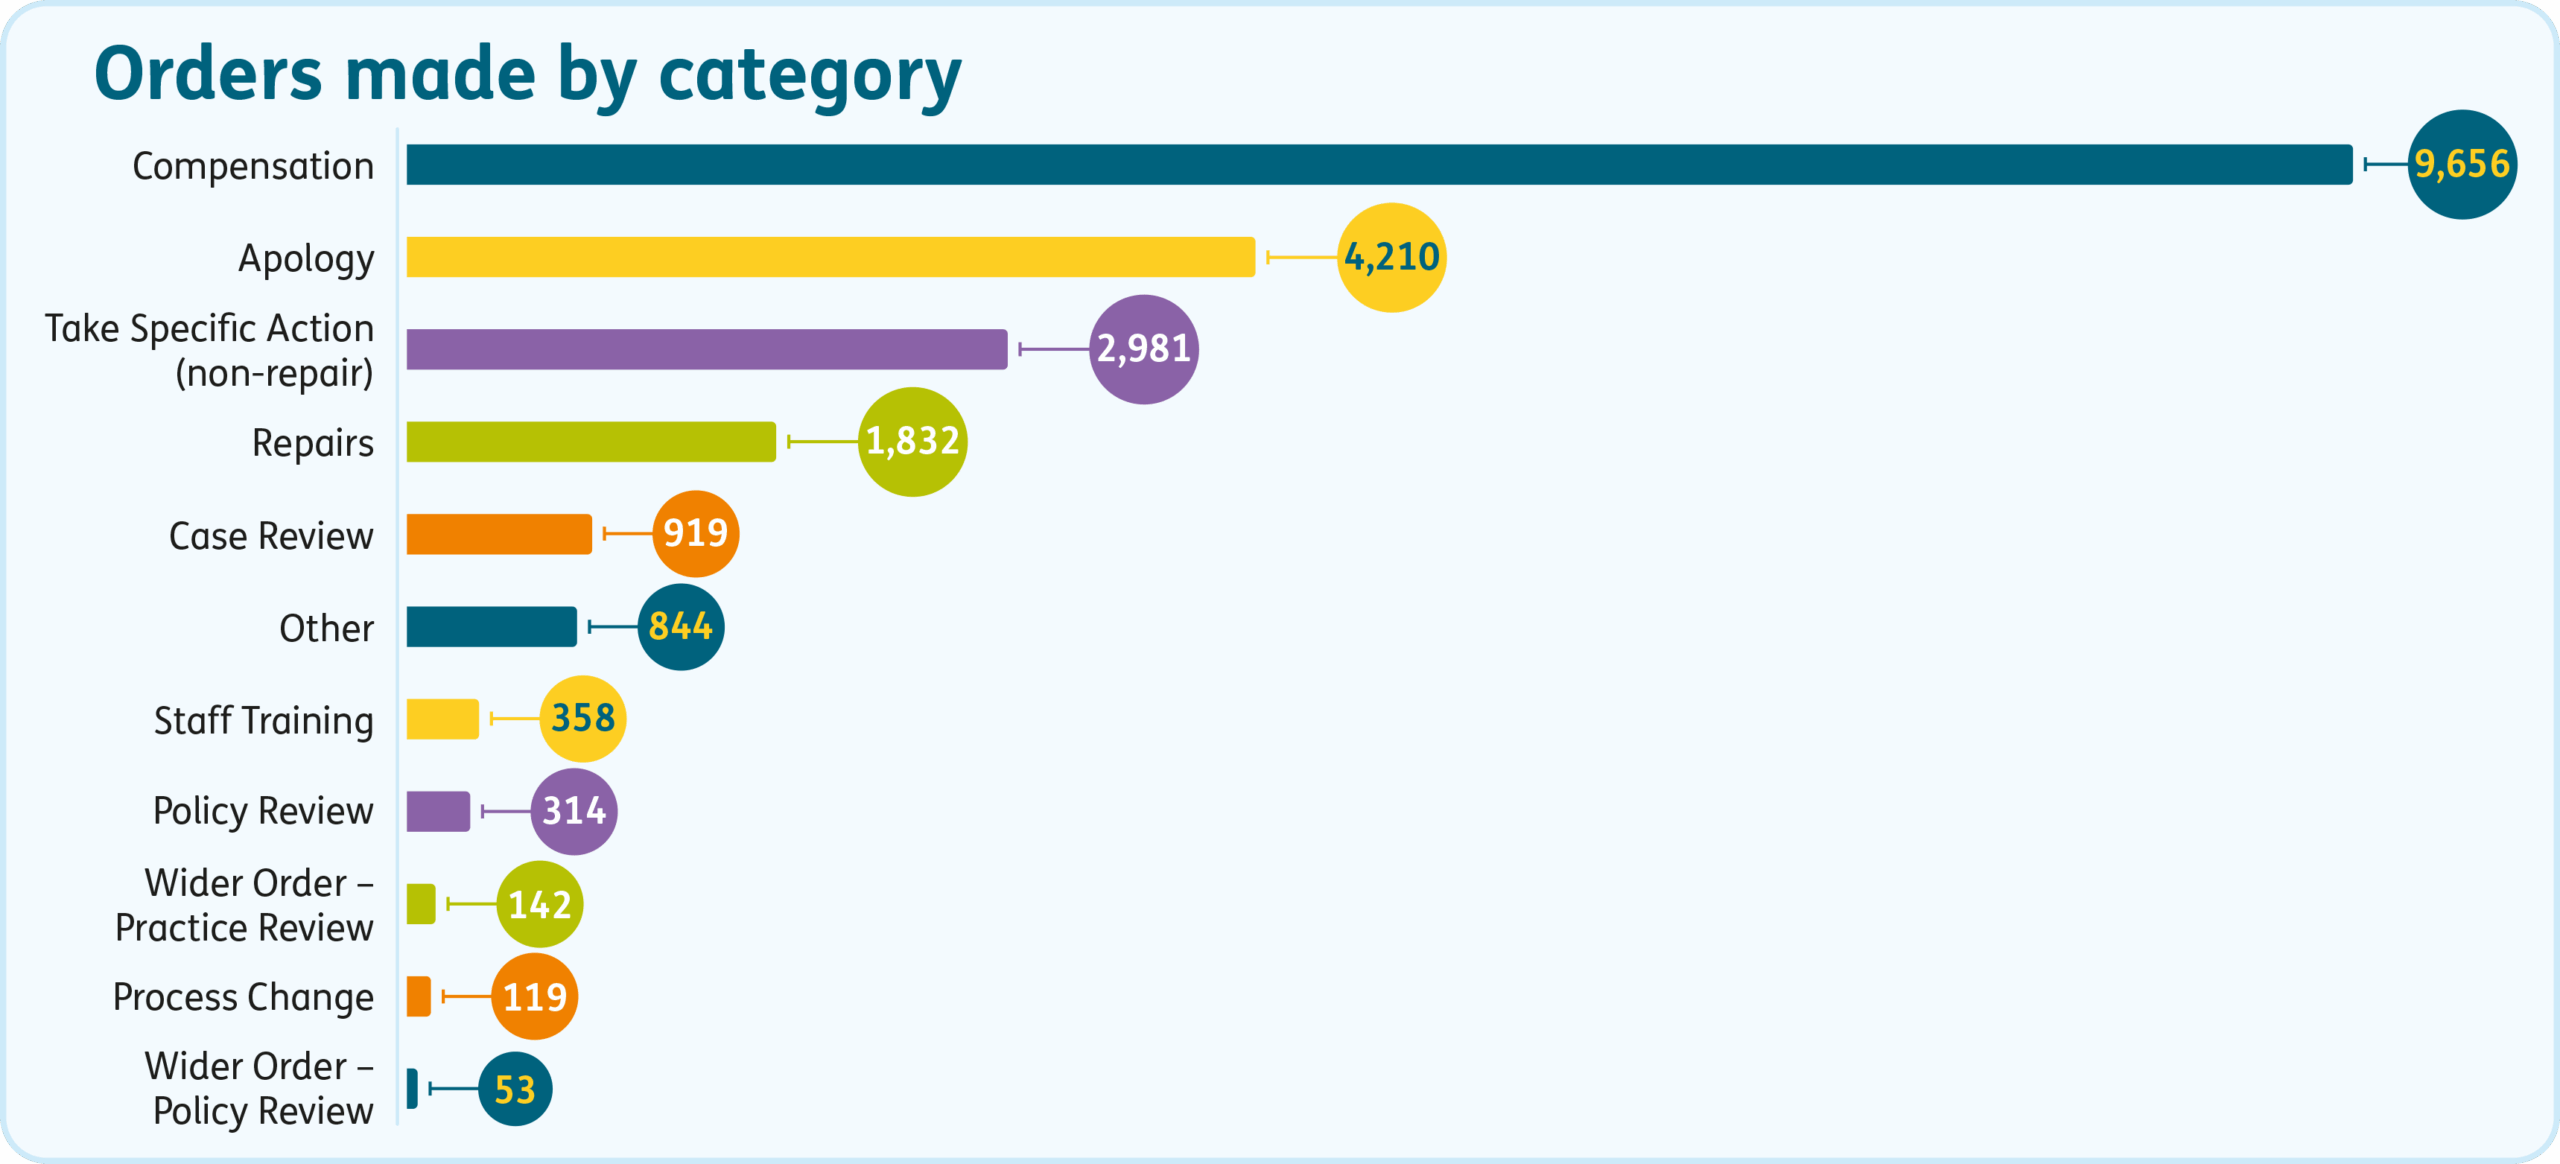
We made 26,901 interventions to put things right for residents, ranging from carrying out repairs to paying compensation and improving practices. This is a 24% increase on the previous year which is broadly in line with the increase in decisions we made.
Apologies
We ordered landlords to make 4,210 apologies to residents for poor handling of their case. Apologies can begin to repair trust between a resident and their landlord. They are a chance for the landlord to show empathy, responsibility, and learning.
Of course, a timely apology at the point of service failure is far more effective. We encourage landlords to use apologies in their local complaint handling alongside other remedies where appropriate.
Compensation
The amount of compensation we ordered increased in line with the number of cases we decided.
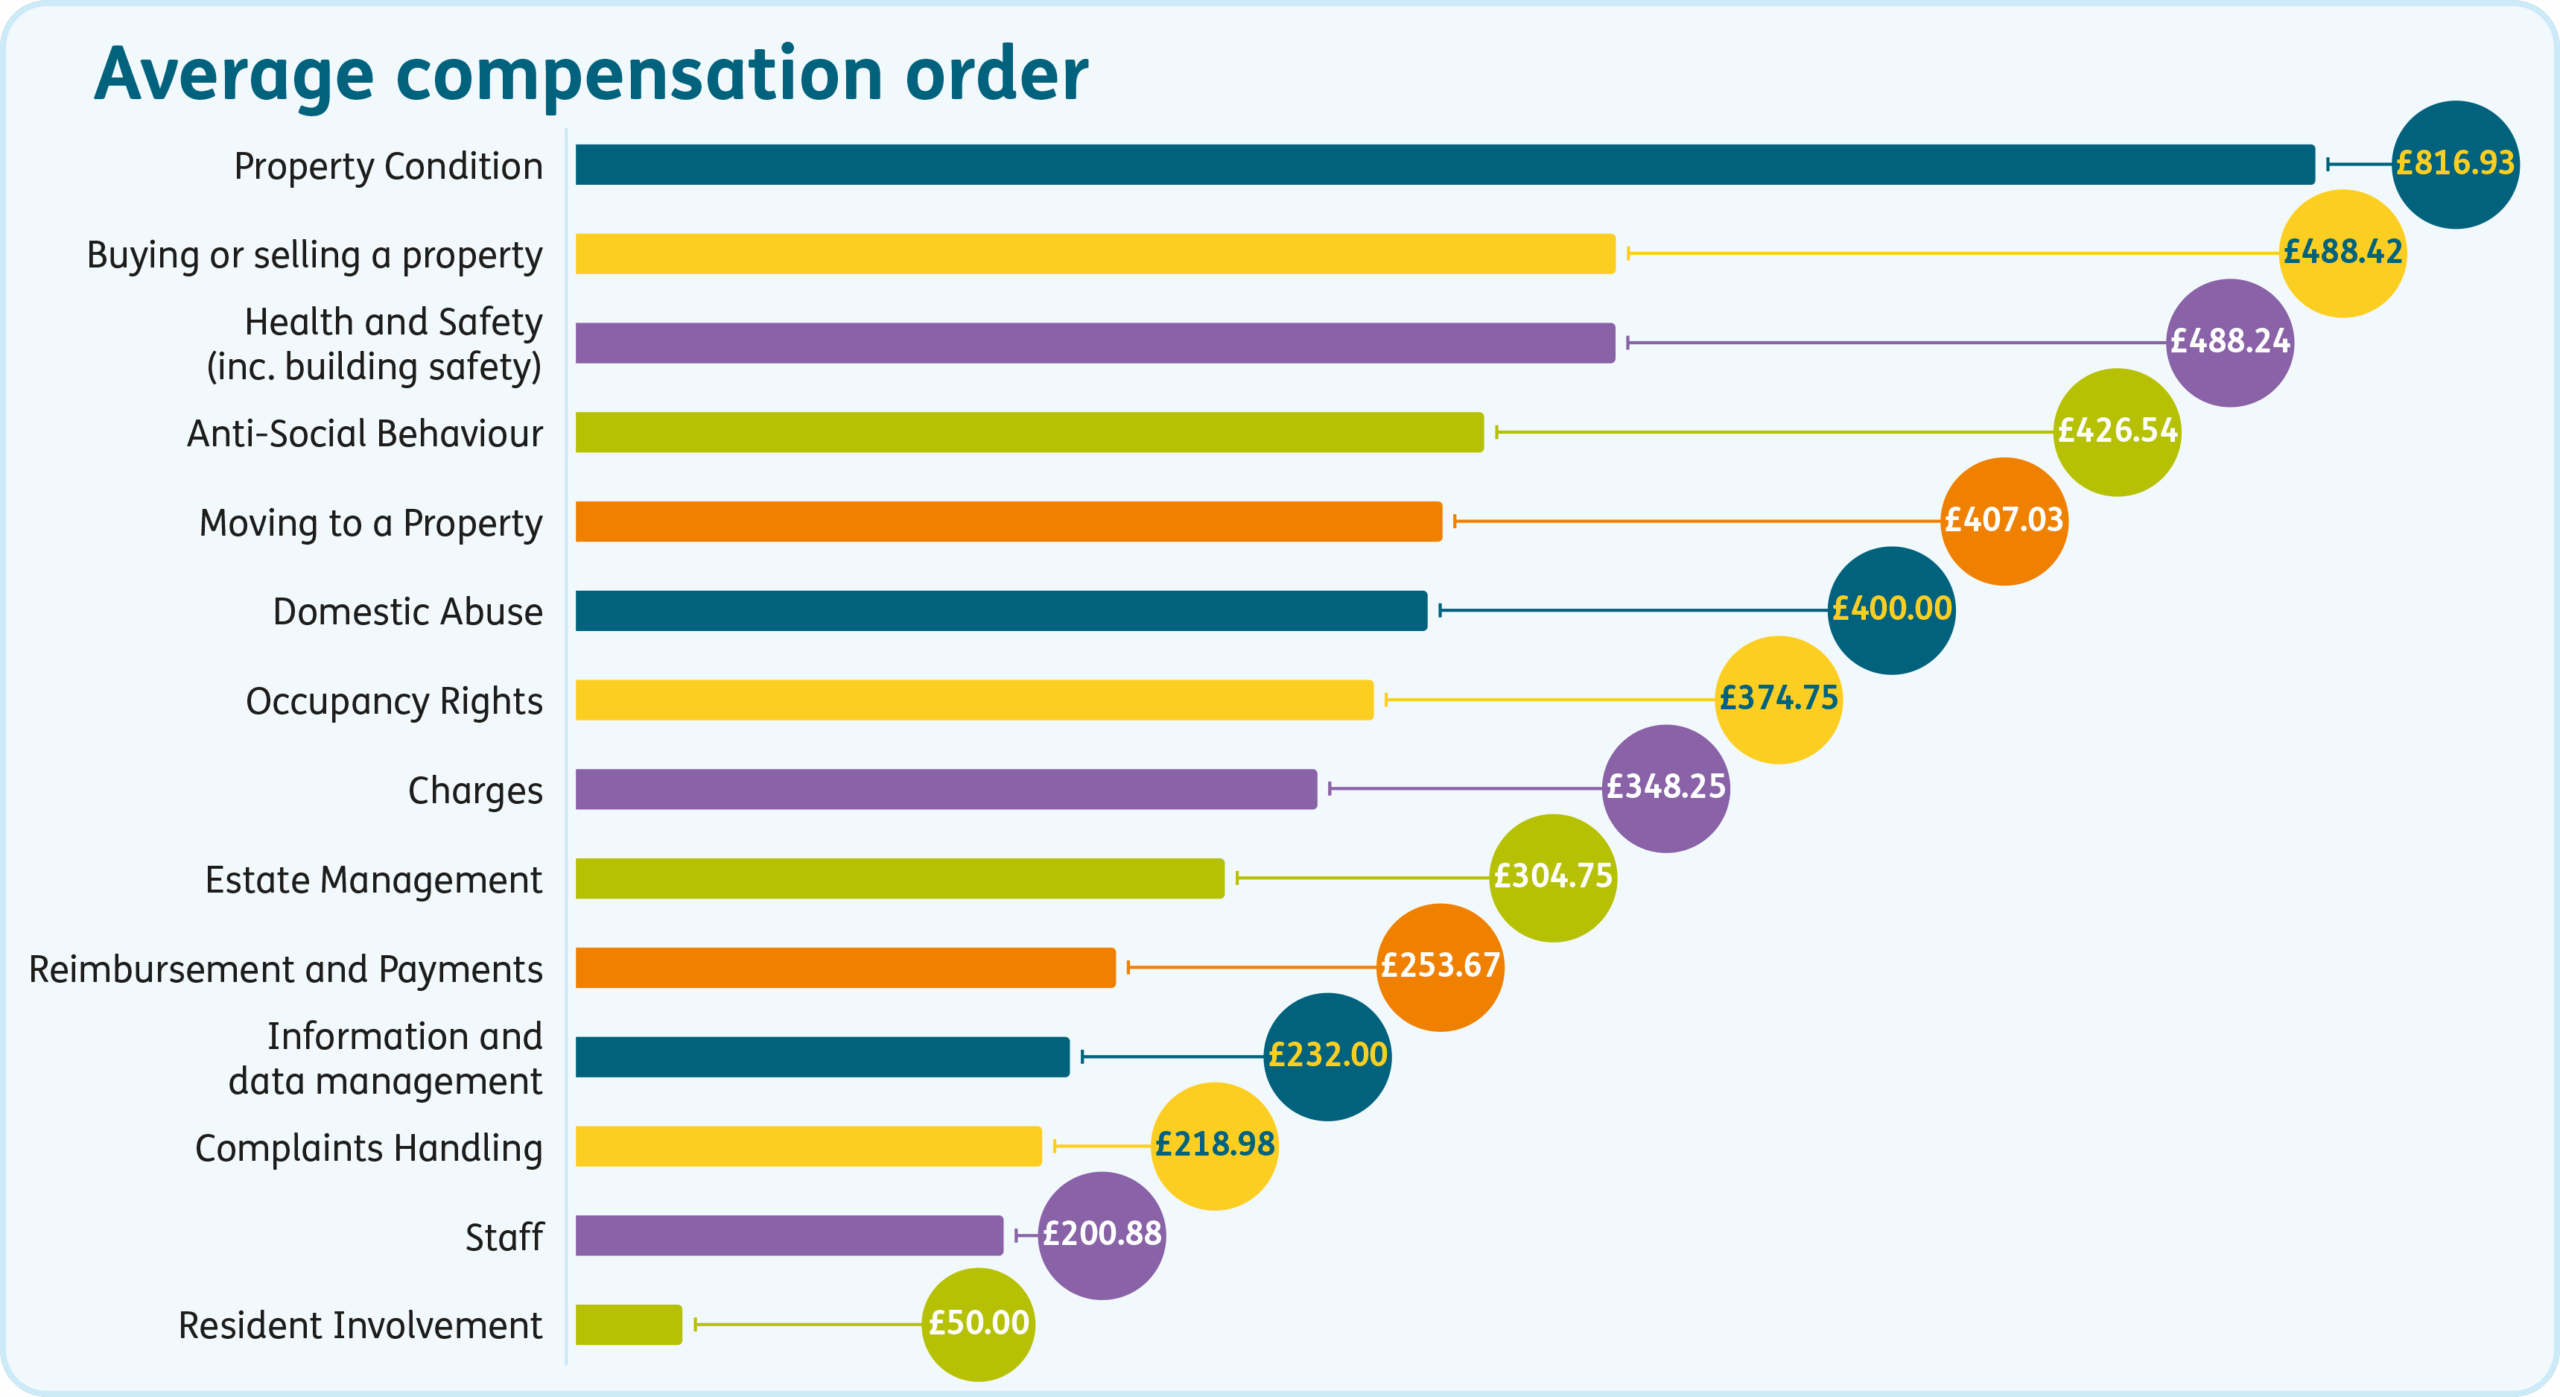
We are always proportionate in our orders of compensation. They are made to restore the resident to the position they would have been in had things not gone wrong. They are not a sanction or punishment against the landlord.
The average amount of compensation ordered per case has fallen. In 2023-24 we ordered an average of £1,151 per upheld case. In 2024-25 this fell to £947 per upheld case. Along with the increase in reasonable redress findings, this suggests improvement in the redress offered by landlords in their own process - even where we find failings.
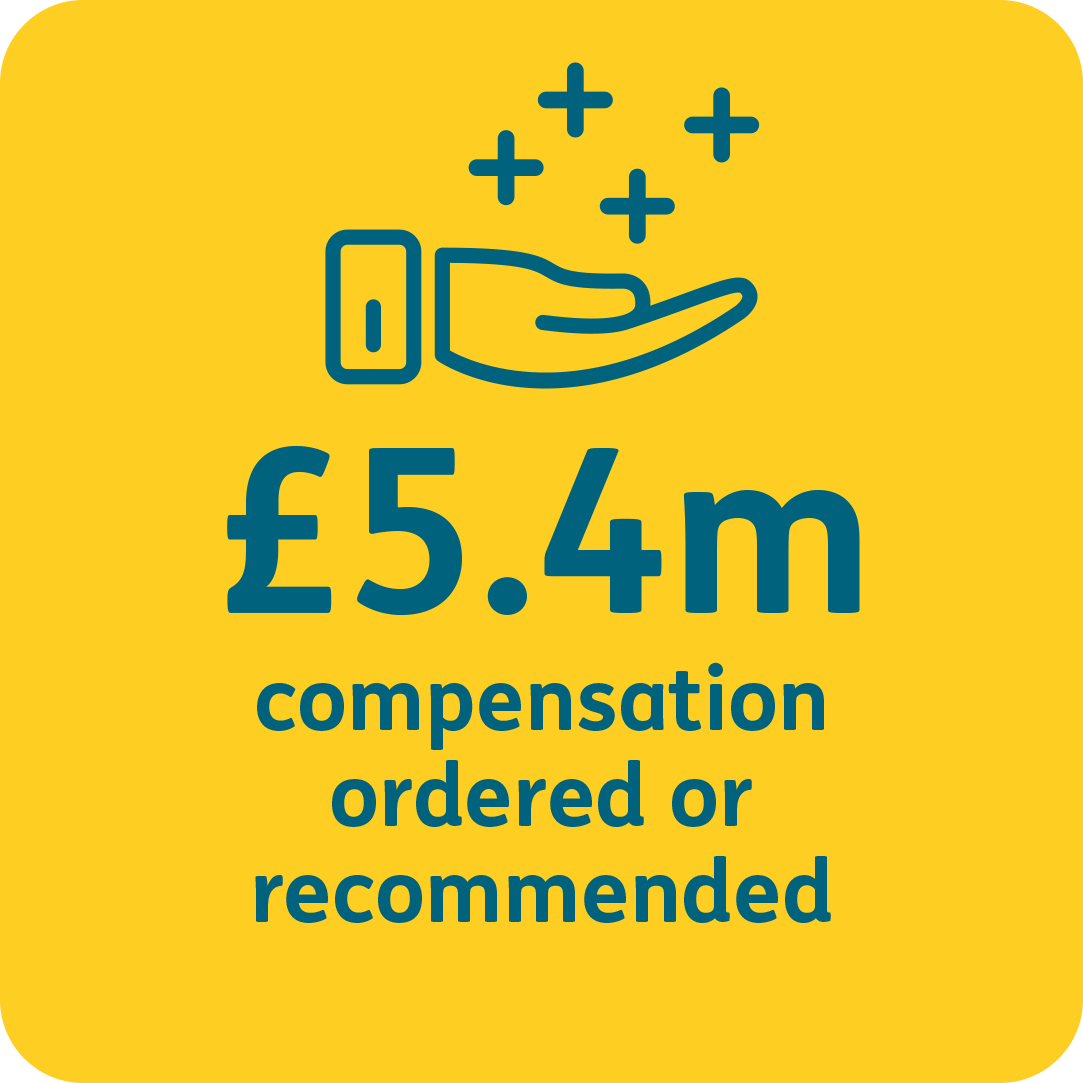
Over 40% of the total compensation we ordered in 2024-25 was for failures in handling leaks, damp and mould. The cases with the largest overall compensation orders often included an amount based on the rent paid by the resident while living in poor conditions. We make these orders when the resident has lost the use of, or had reduced use of, part of their home.
In 578 cases we made compensation orders of more than £2,000 – more than double the average amount. The largest order we made in 2024-25 was almost £32,000. The larger compensation orders also often reflect:
- the effect on more vulnerable households including infants, the elderly, and disabled or unwell residents
- the length of any delay
- poor knowledge and information management
- the failure to provide a human-centric service
We urge landlords to consider the findings and recommendations in our Spotlight reports on damp and mould, knowledge and information management, and attitudes, respect and rights.
Wider orders
We gained new powers to issue wider orders under the Social Housing Regulation Act. This allows us to extend fairness more widely amongst residents. We can require landlords to look beyond the individual complaints and address wider issues.
93 landlords received wider orders in 2024-25. The majority of those were landlords with between 10,000 and 49,999 homes, followed by housing associations with more than 50,000 homes.
Failures in managing damp and mould, including poor knowledge and information management, were the most frequent issues resulting in wider orders. The provisions of Awaab’s Law will require landlords to perform better in these areas. The learning identified by landlords in several of these cases is available on our website.
Regional data
The regional breakdown shows a 50% increase in complaints from residents in the East of England. The uphold rate remained consistent here, although the region has the second-highest proportion of severe maladministration findings. This increase in volume is striking. Landlords in the region may wish to consider the learning highlighted in our investigations.
The lowest uphold rate was 62% in the North West, which is an improvement over last year’s 67%.
The South West saw the biggest decrease in maladministration rate from 71% to 63%. The severe maladministration rate in this region also halved, as it did in the South East. However, the South East has the highest proportion of complaints per property of all regions outside of London.
The proportion of complaint categories is largely consistent across England. Exceptions to this are that:
- the South West has the lowest proportion of complaints about property condition (38%)
- the North East and Yorkshire has the highest proportion of complaints about ASB (10%)
- London has an exceptionally high severe maladministration rate for property condition (12%)
The highest uphold rates for poor complaint handling are found in the Midlands and in North and East Yorkshire.
Individual landlord performance
Individual landlord performance reports are issued to landlords with 5 or more findings in investigations issued that year. There are 281 landlords with performance reports for 2024-25.
These reports provide landlords with more detail on their performance. This includes trend analysis over previous financial years and how they compare to other landlords of a similar size and type. These are important reports for the landlord’s Member Responsible for Complaints to review and talk to colleagues about.
Landlords with an uphold rate of 75% or higher
There were 120 landlords with a maladministration rate of 75% or higher. The Ombudsman has written to Chief Executives of landlords who have a maladministration rate of over 75%.
Landlords with a maladministration rate of 75% or higher
The Member Responsible for Complaints and senior leaders at these landlords must urgently consider how to improve in the service areas where we have upheld complaints.
Landlords with improved performance
Encouragingly, we have seen instances where landlords had positive complaint handling cultures. There are 2 landlords with 5 findings or more who have a 0% maladministration rate - Pickering and Ferens Homes and North Devon Homes.
Additionally, we have seen 16 landlords that have substantially lower maladministration rates and numbers of maladministration findings compared to last year.
Landlords with a substantially improved maladministration rate
In our investigations about these landlords, we found evidence of:
- thoughtful and compassionate language
- appropriate use of apologies
- human-centric approaches toward vulnerable residents
- awareness of and compliance with legal obligations, policies and procedures
- damp and mould investigations which did not infer blame on the resident
We have written to these landlords to welcome the figures shown in their reports. We’ll also be sharing learning from these landlords through our Centre for Learning.
Creating a positive complaint handling culture and ensuring that it works in practice can sometimes be a long-term process, and it is encouraging to see many landlords on their way to improving their maladministration rate.
Looking ahead to a positive complaint handling future
Complaints are a strategic tool for landlords to use and learn from. They are more than individual transactions. Complaints are a chance for landlords to reflect on what went wrong and to think about how to prevent problems from arising again. The Annual Complaints Review shows this on a national scale. We encourage landlords to learn from this review and look to improve practice, policy, and performance.
Housemark’s analysis indicates that effective complaint handling contributes to overall satisfaction and contributes to landlords meeting consumer standards. Higher-performing landlords receive higher stage 1 complaint volumes and handle them more effectively. This reinforces the message that complaints are key to learning and effective service delivery and, if handled well, can lead to better all-round performance.
Our Centre for Learning has eLearning modules and workshops to give housing professionals free-to-access materials to improve services. It also has case studies, reports, podcasts, and other resources about significant topics the sector is facing.
Our findings suggest the sector’s complaint handling is improving. We urge our member landlords to continue this direction of travel. We’ll continue to support this with our interventions, decisions, remedies, and wider orders.
We’ll also continue to provide as much support as we can through our insight and development work. Our 2025 Spotlight on repairs and maintenance, “Repairing Trust”, was produced to support landlords to learn from complaints about property condition. We are now beginning work on our next Spotlight report on mergers. This is another important time in the life of some landlords where services to residents often suffer.
Landlords work in a complicated and changing environment. This will include more use of artificial intelligence by both landlords and their residents in the complaints process. It also includes legal and regulatory changes. The advent of Awaab's Law, a reformed Decent Homes Standard, and the Regulator’s Competence and Conduct Standard could transform housing management over the next decade. These changes seek to improve the minimum standards of social housing. To ensure the success of these measures, landlords must continue to learn from complaints for the benefit of this and future generations.