Resident Panel membership
Membership panel demographic data is right at the time of the panel implementation.
On this page
About this data
Our Resident Panel is made up of social housing residents that live in England.
We want the membership of the panel to represent the diversity of England’s social housing population, with representation from across a range of demographics and protected characteristics.
This data is representative of the 1,532 applicants we received to the Resident Panel in 2024.
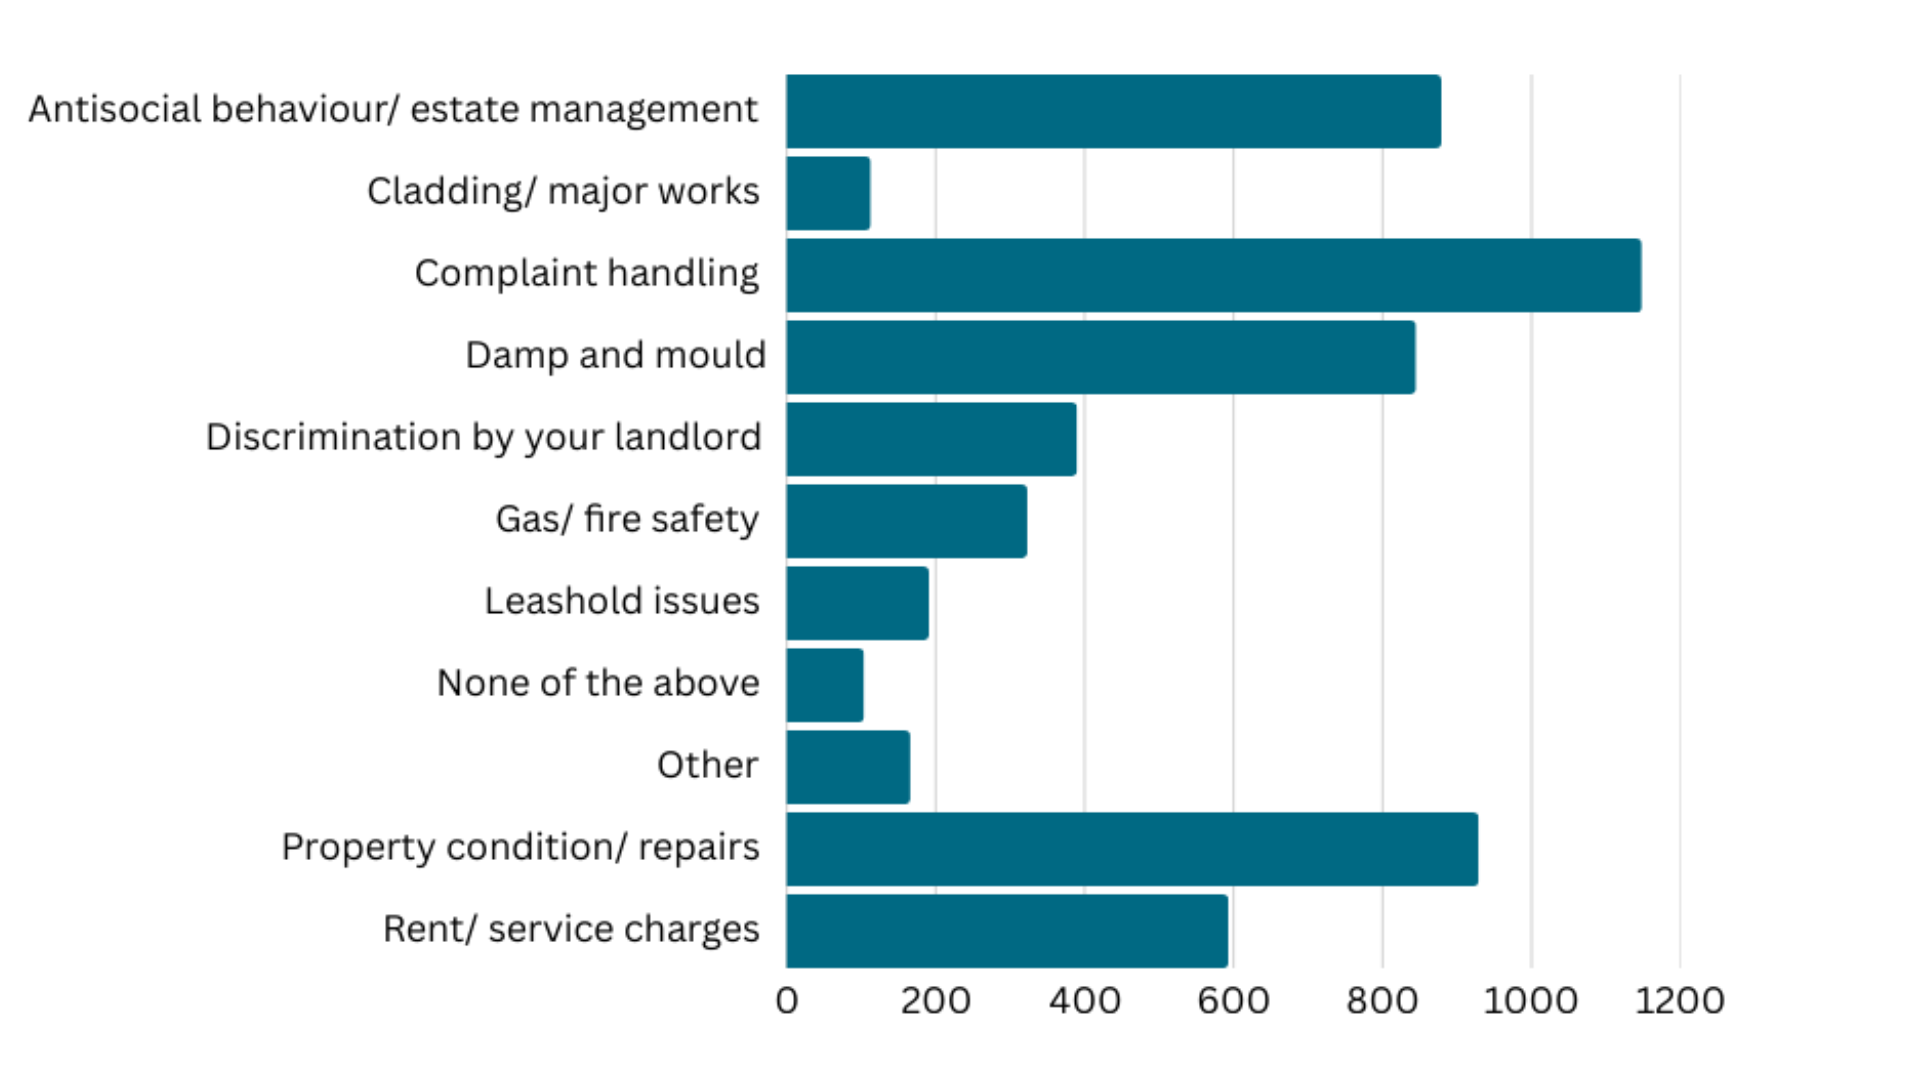
Housing issues experienced by the Resident Panel
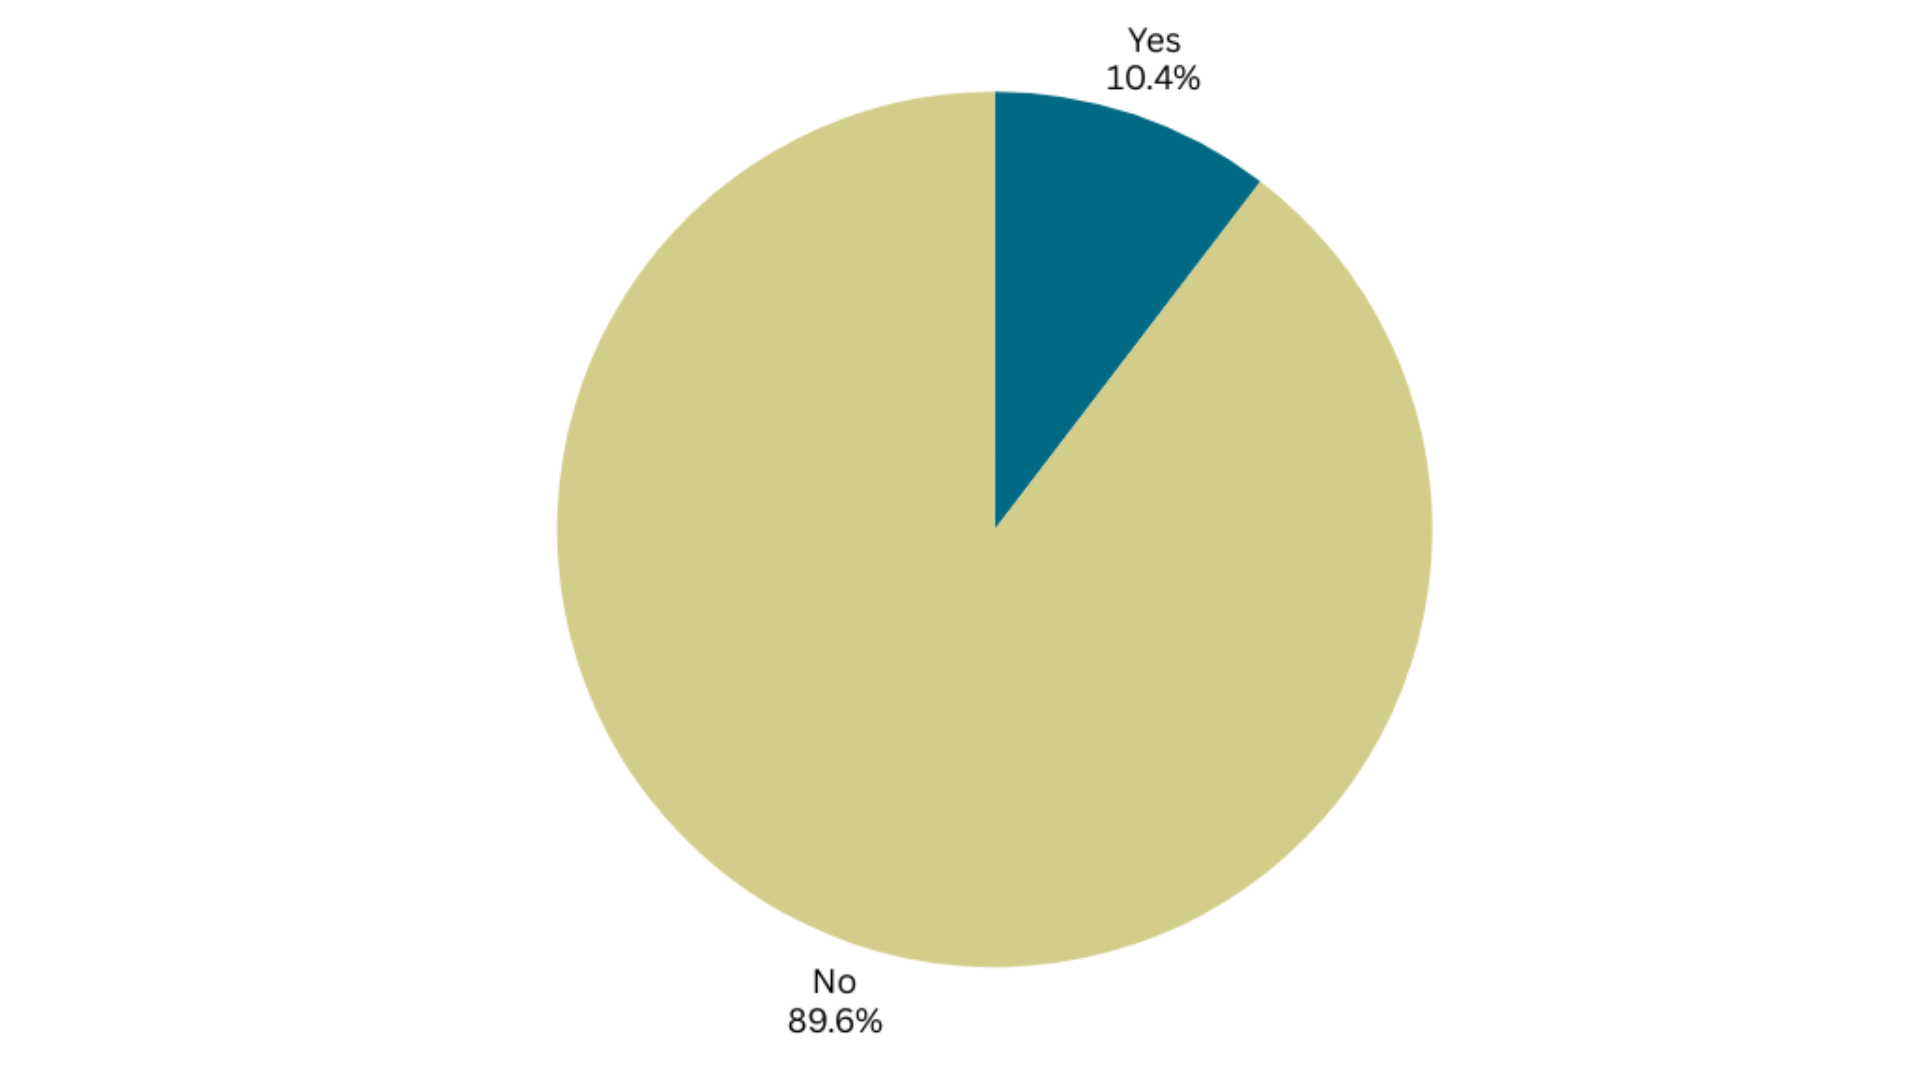
Members that were on the 2021-24 panel
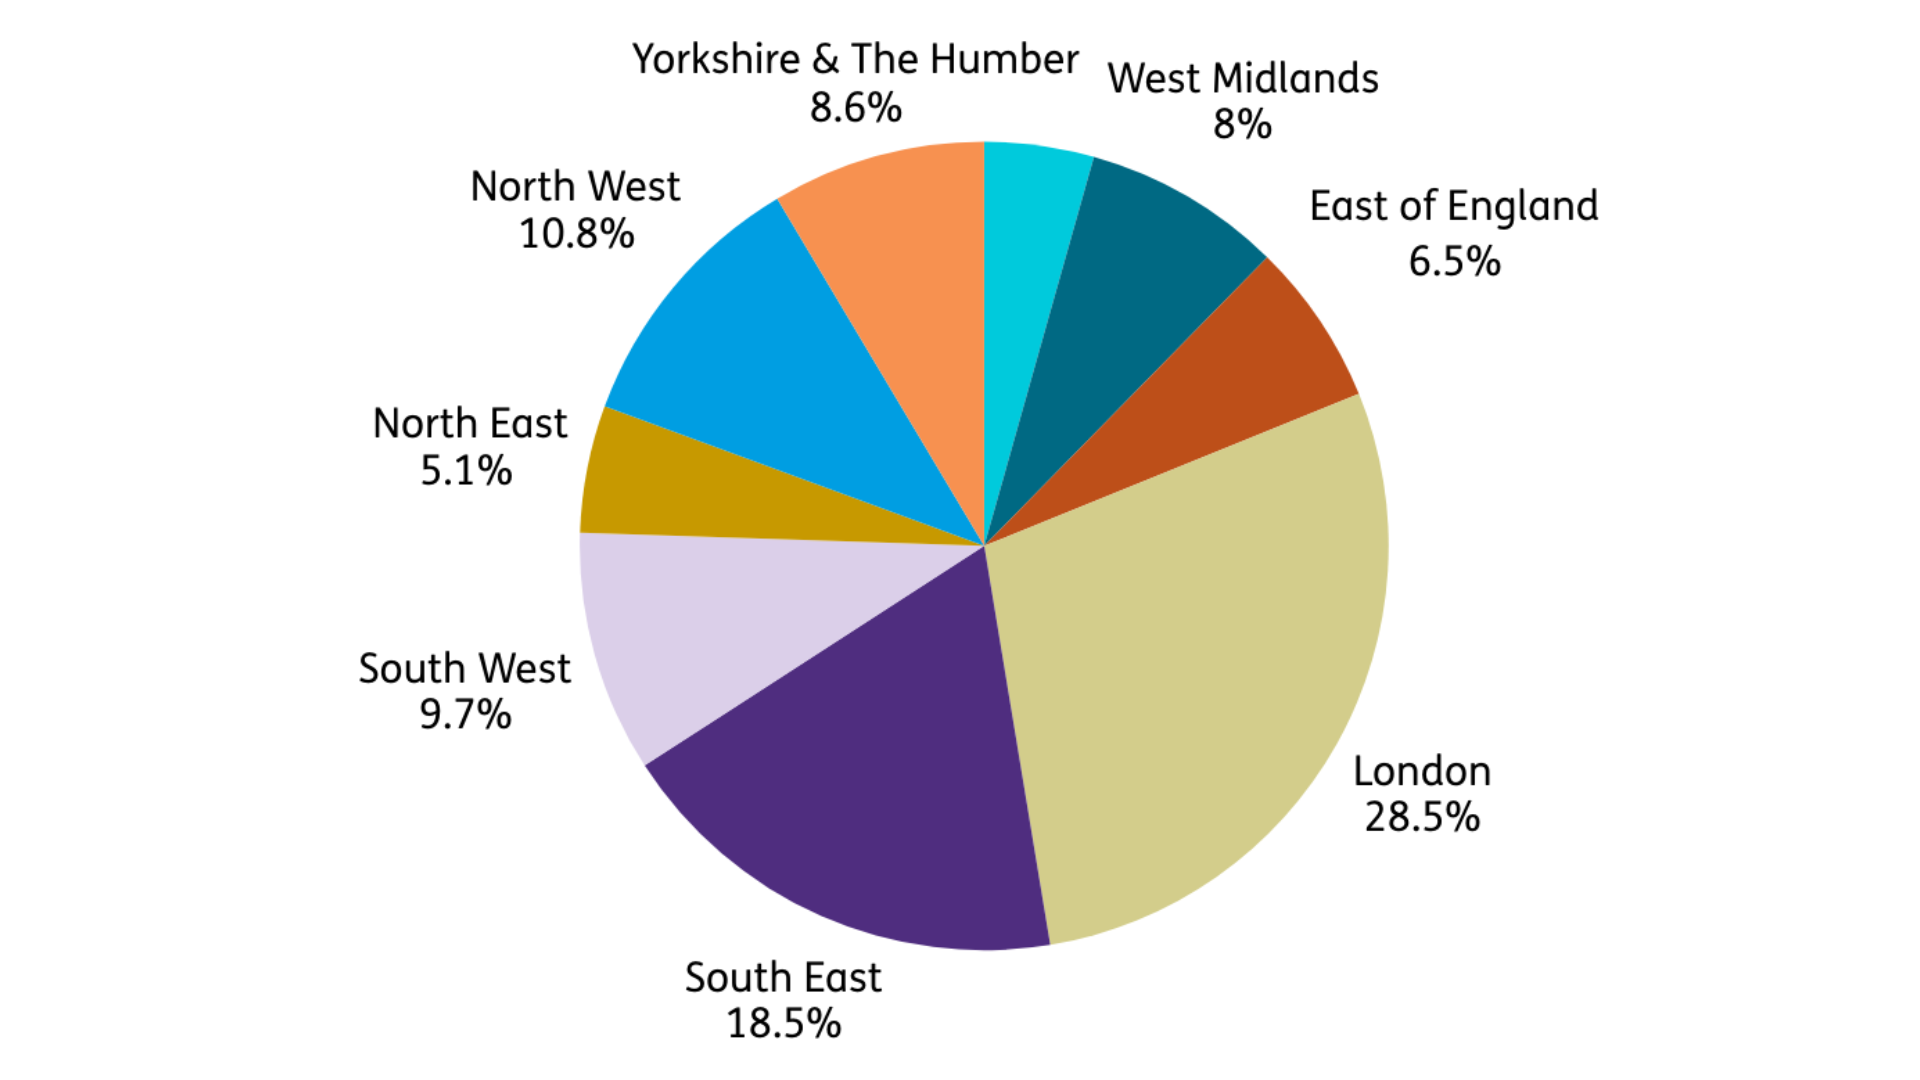
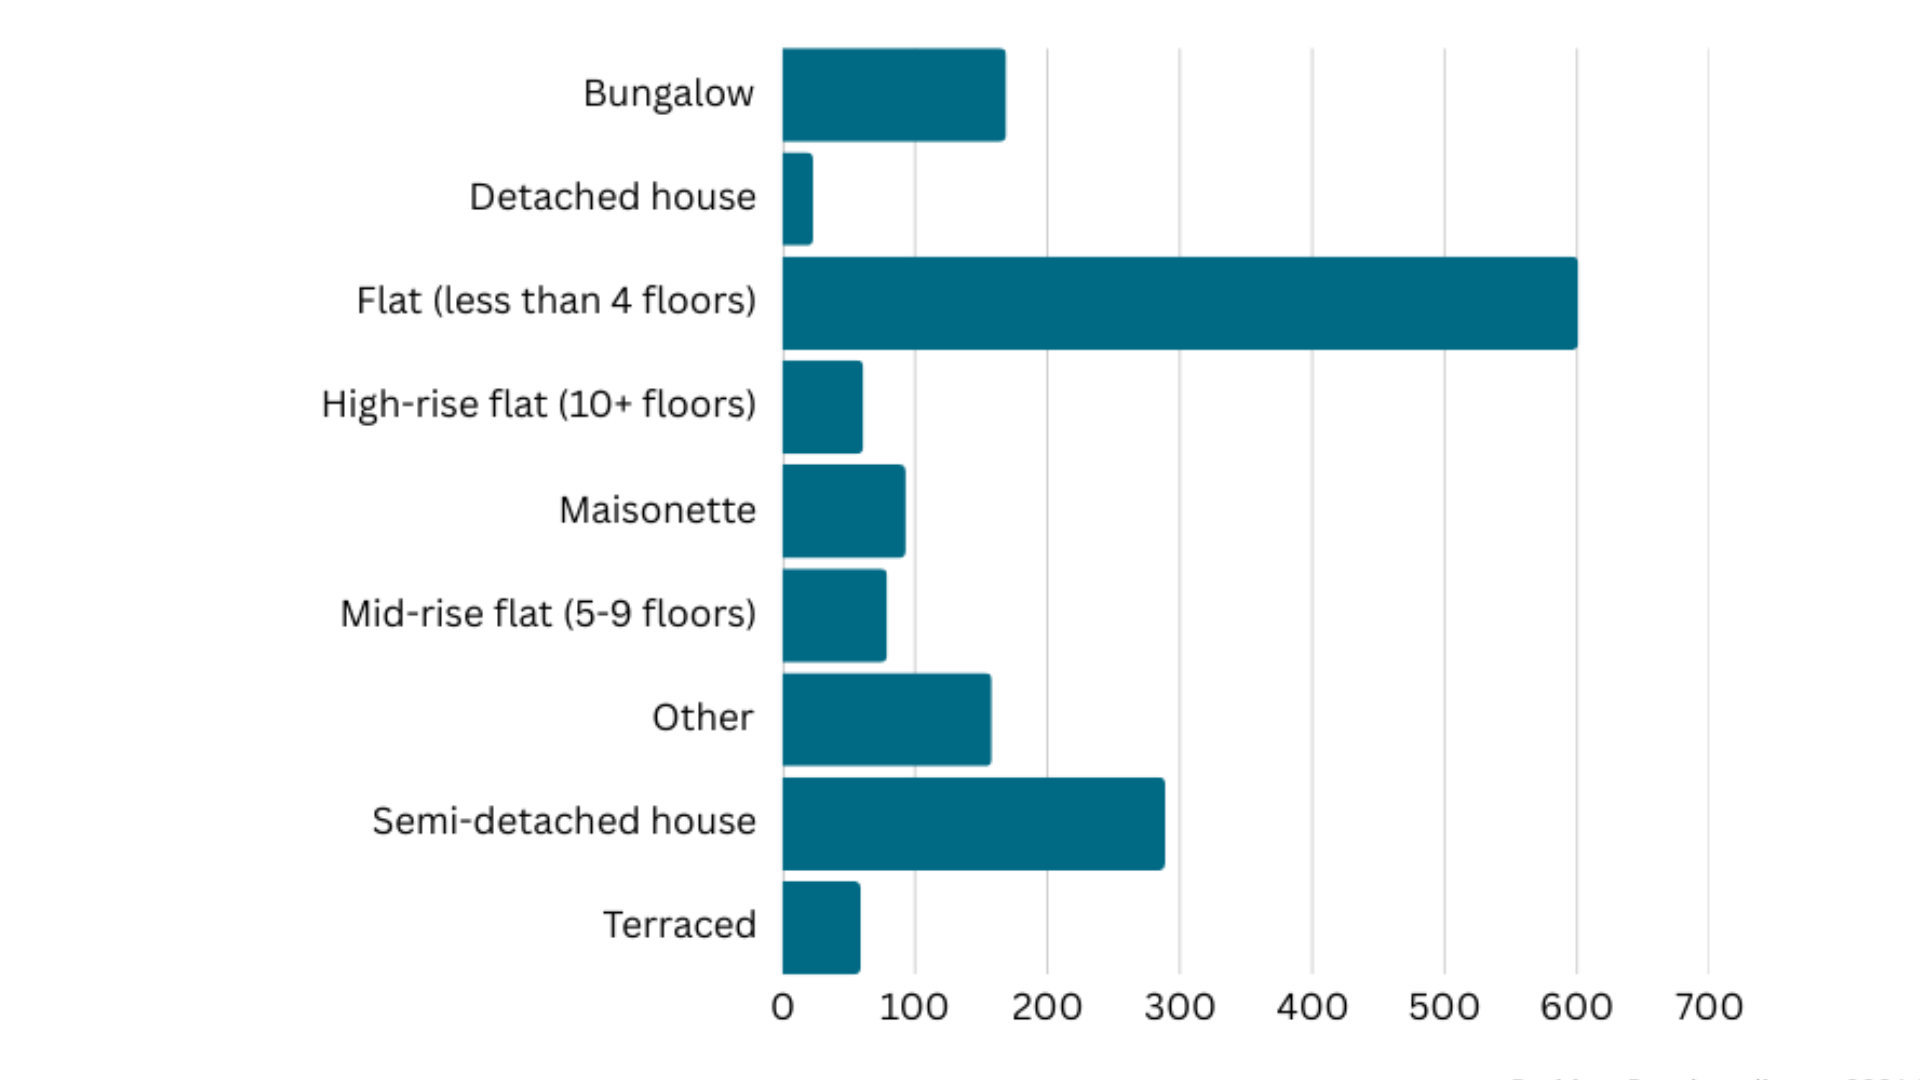
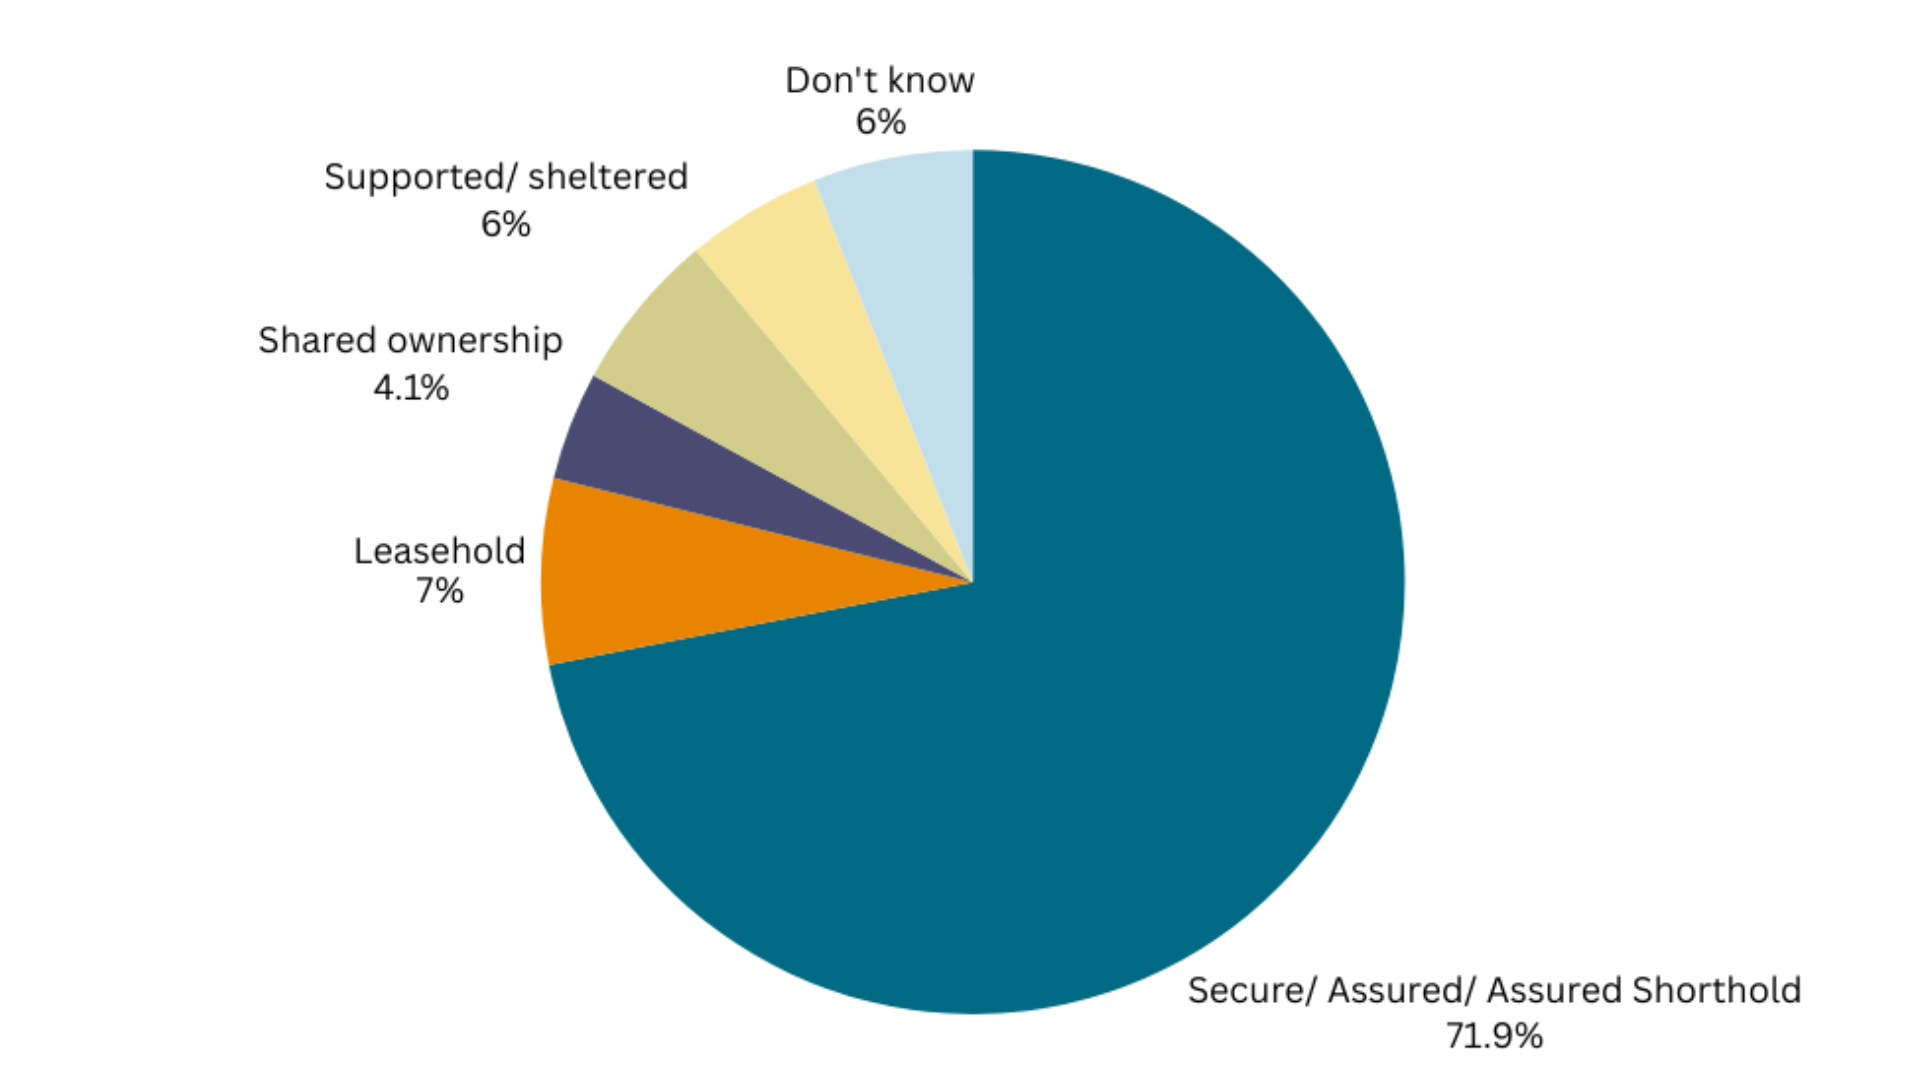
Housing of the Resident Panel
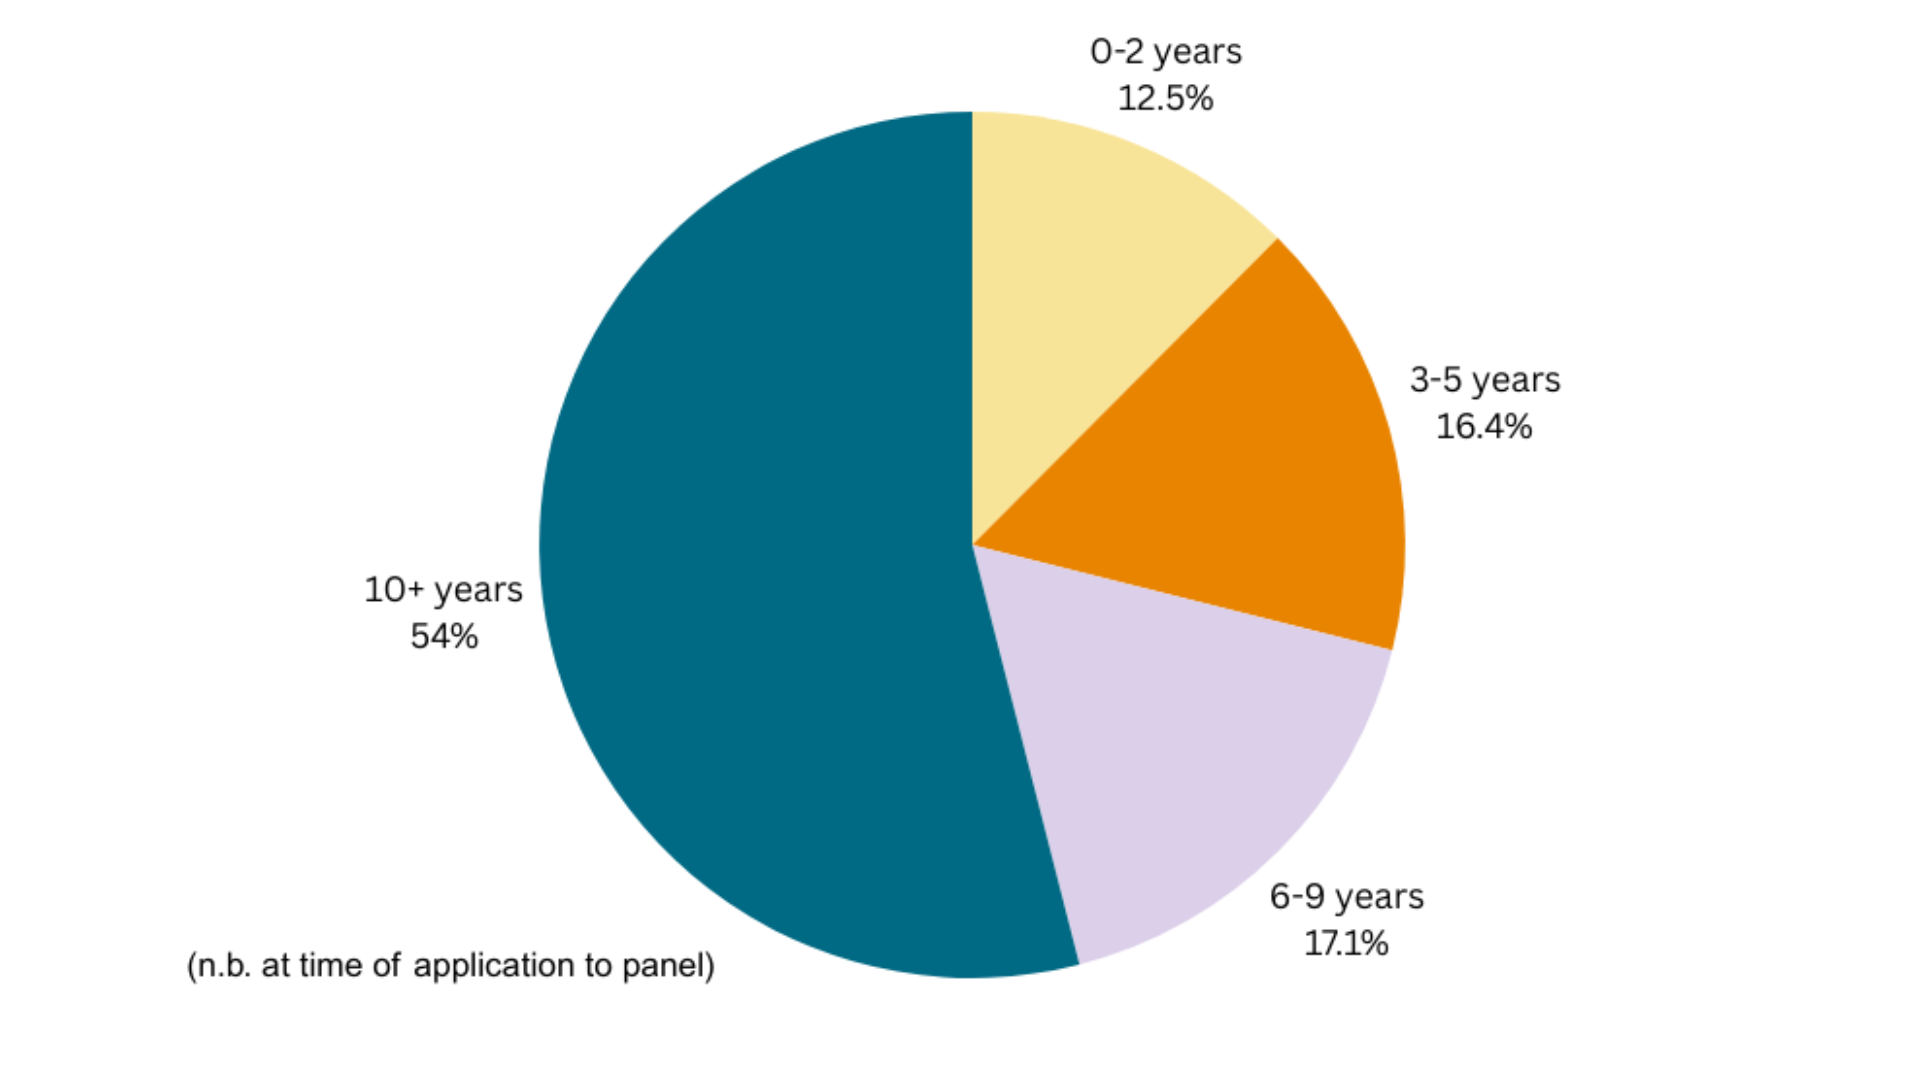
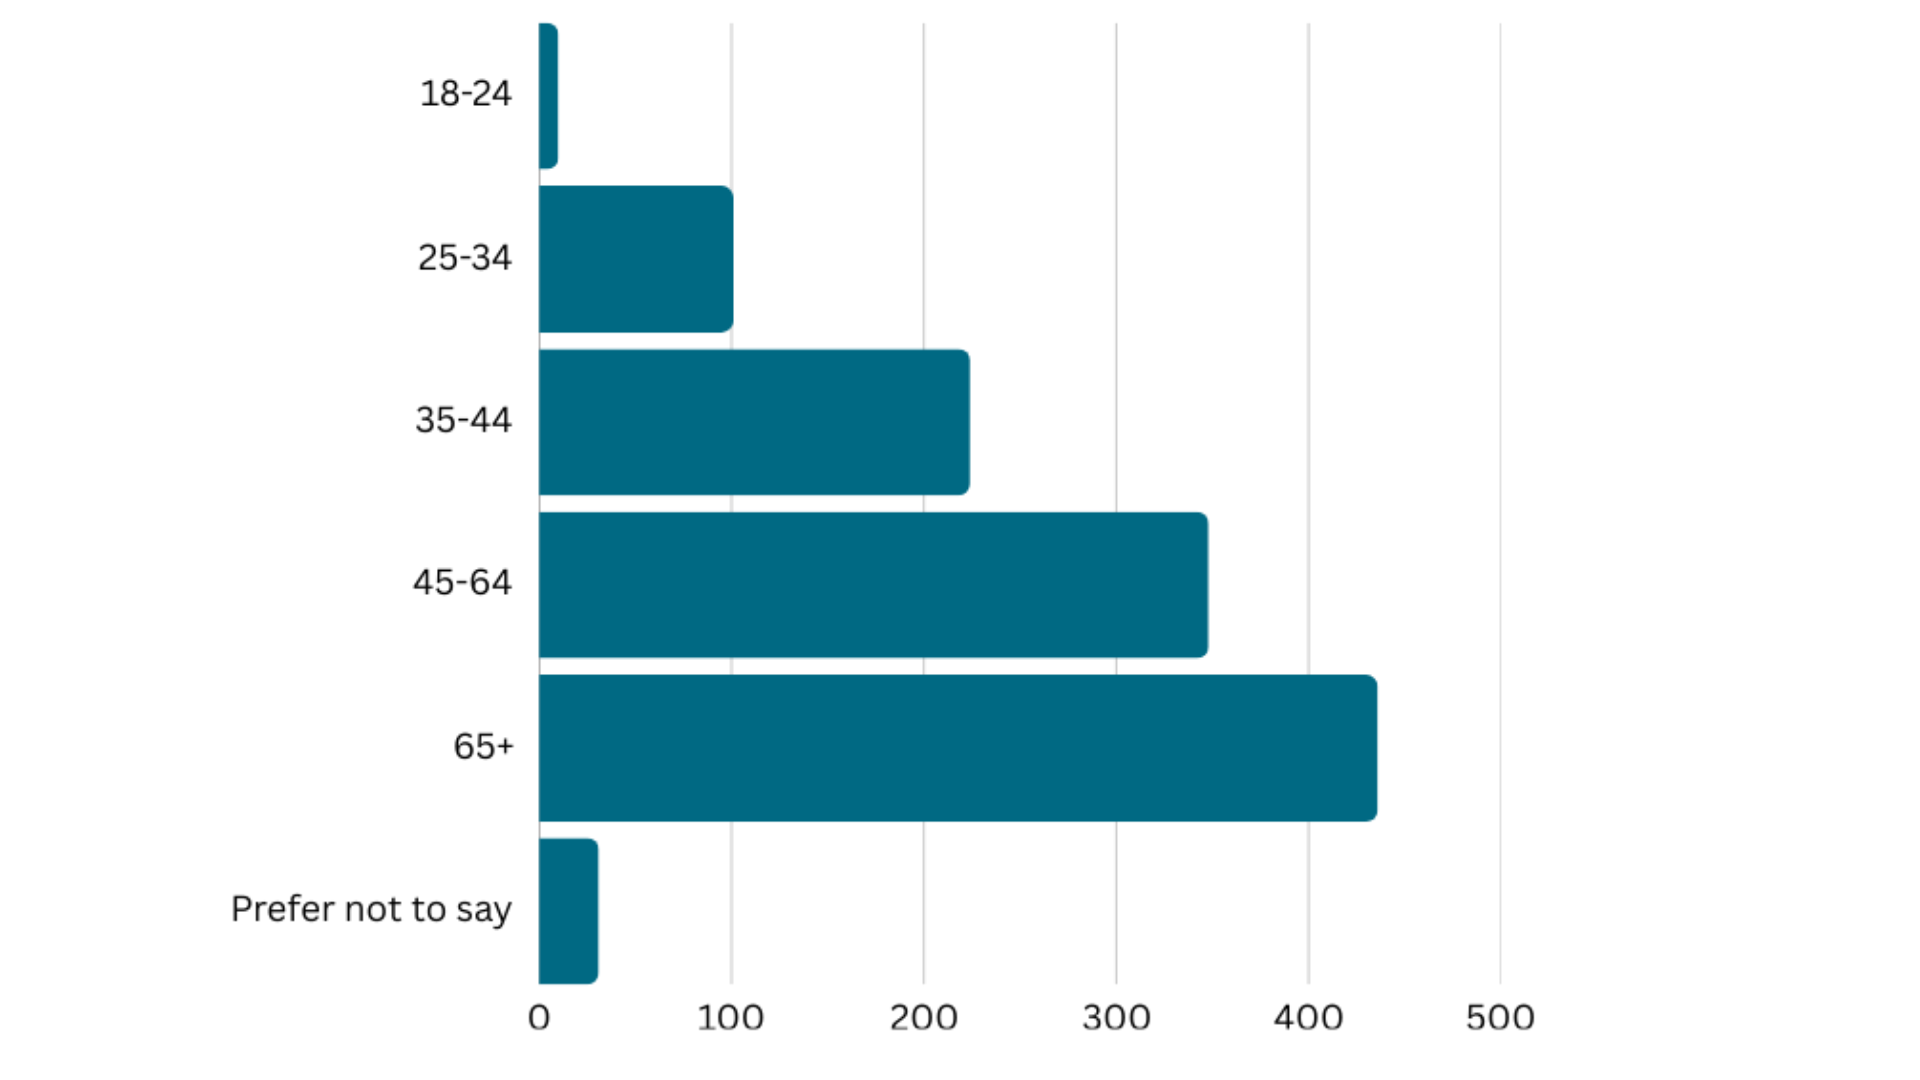
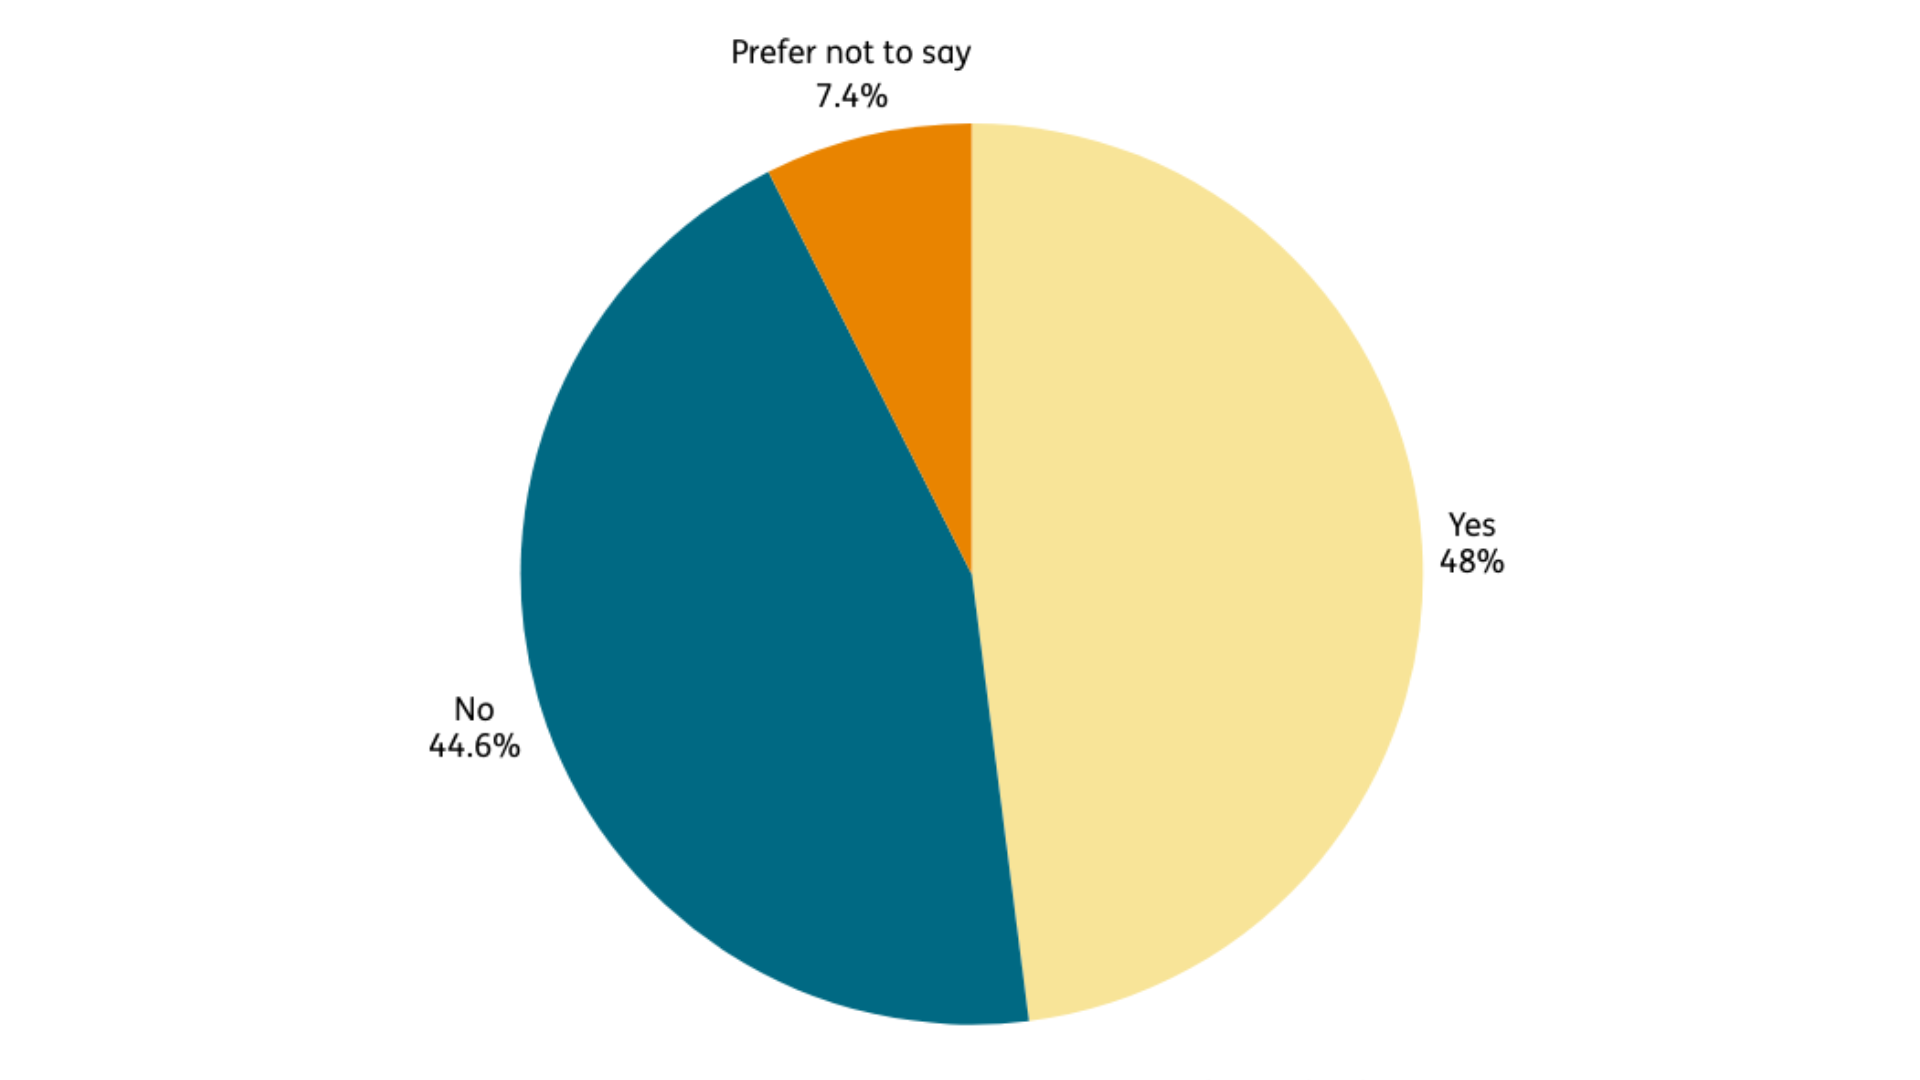
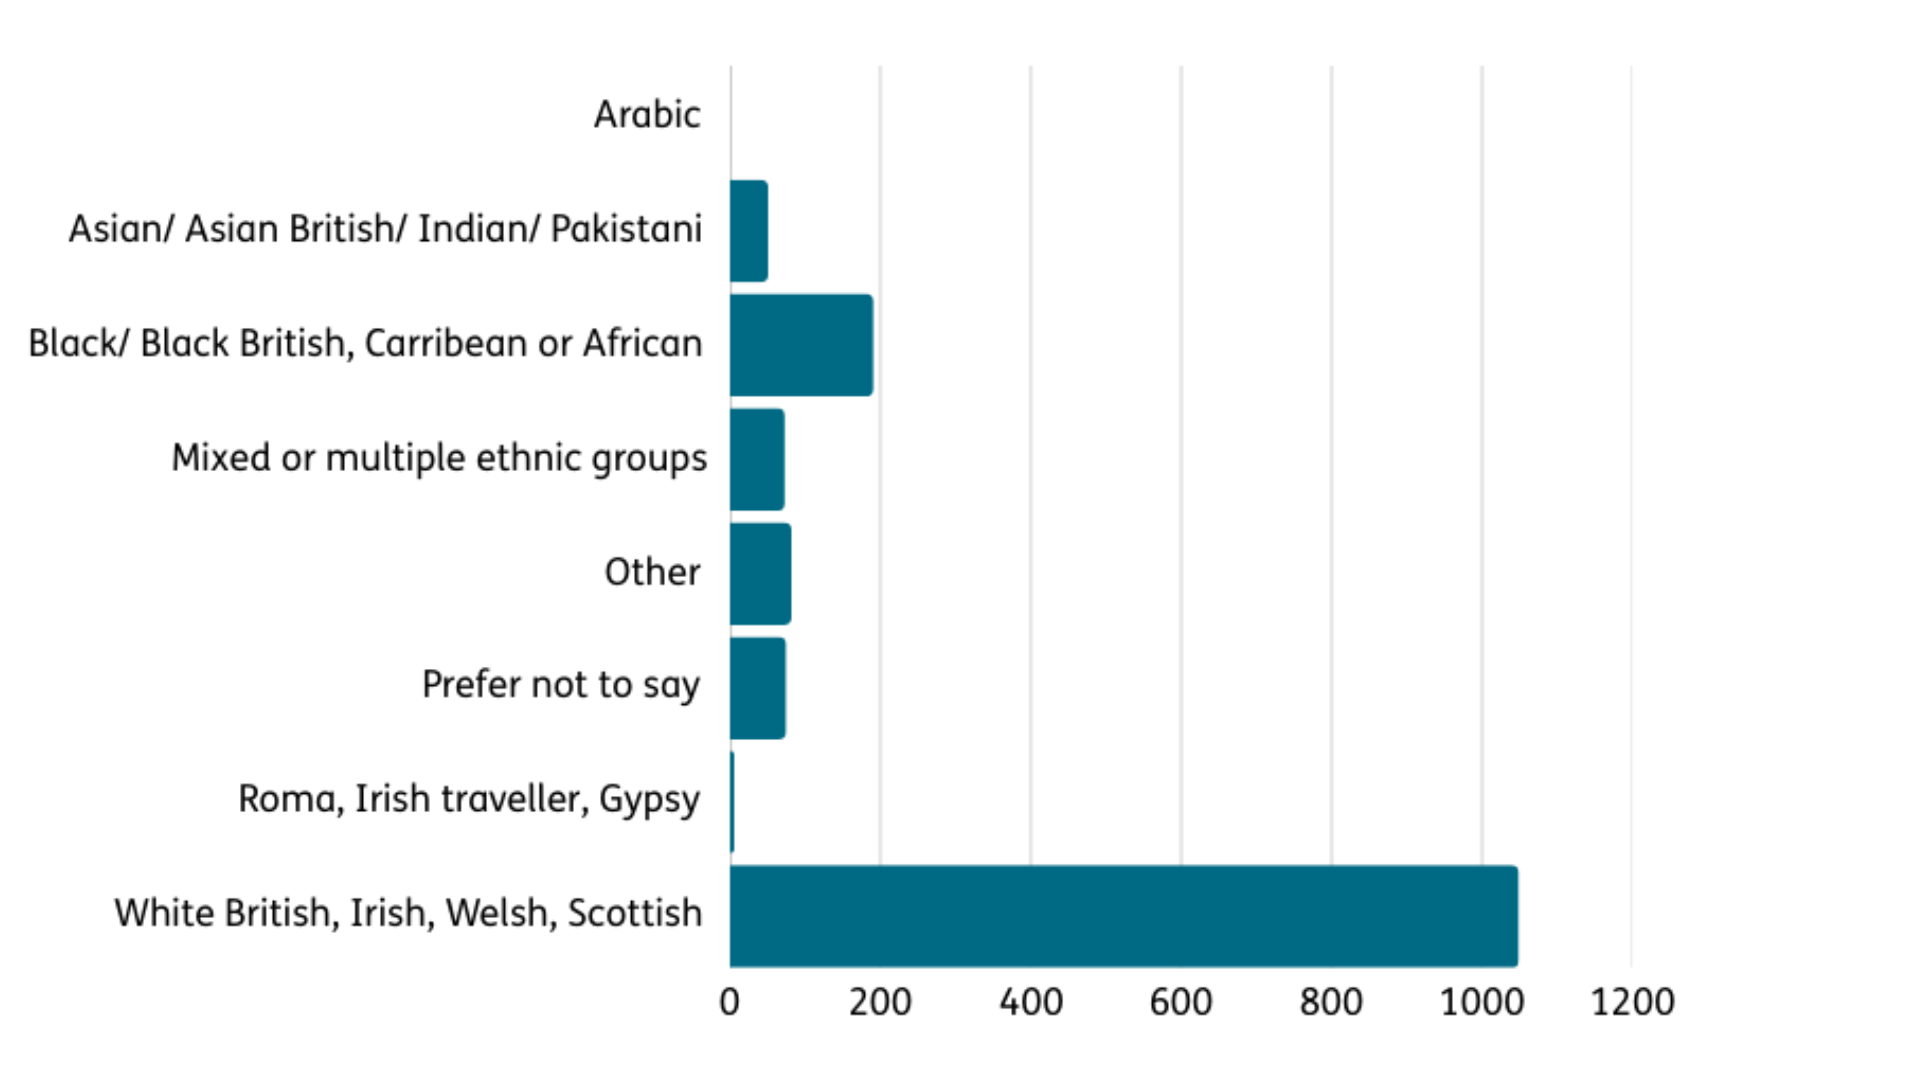
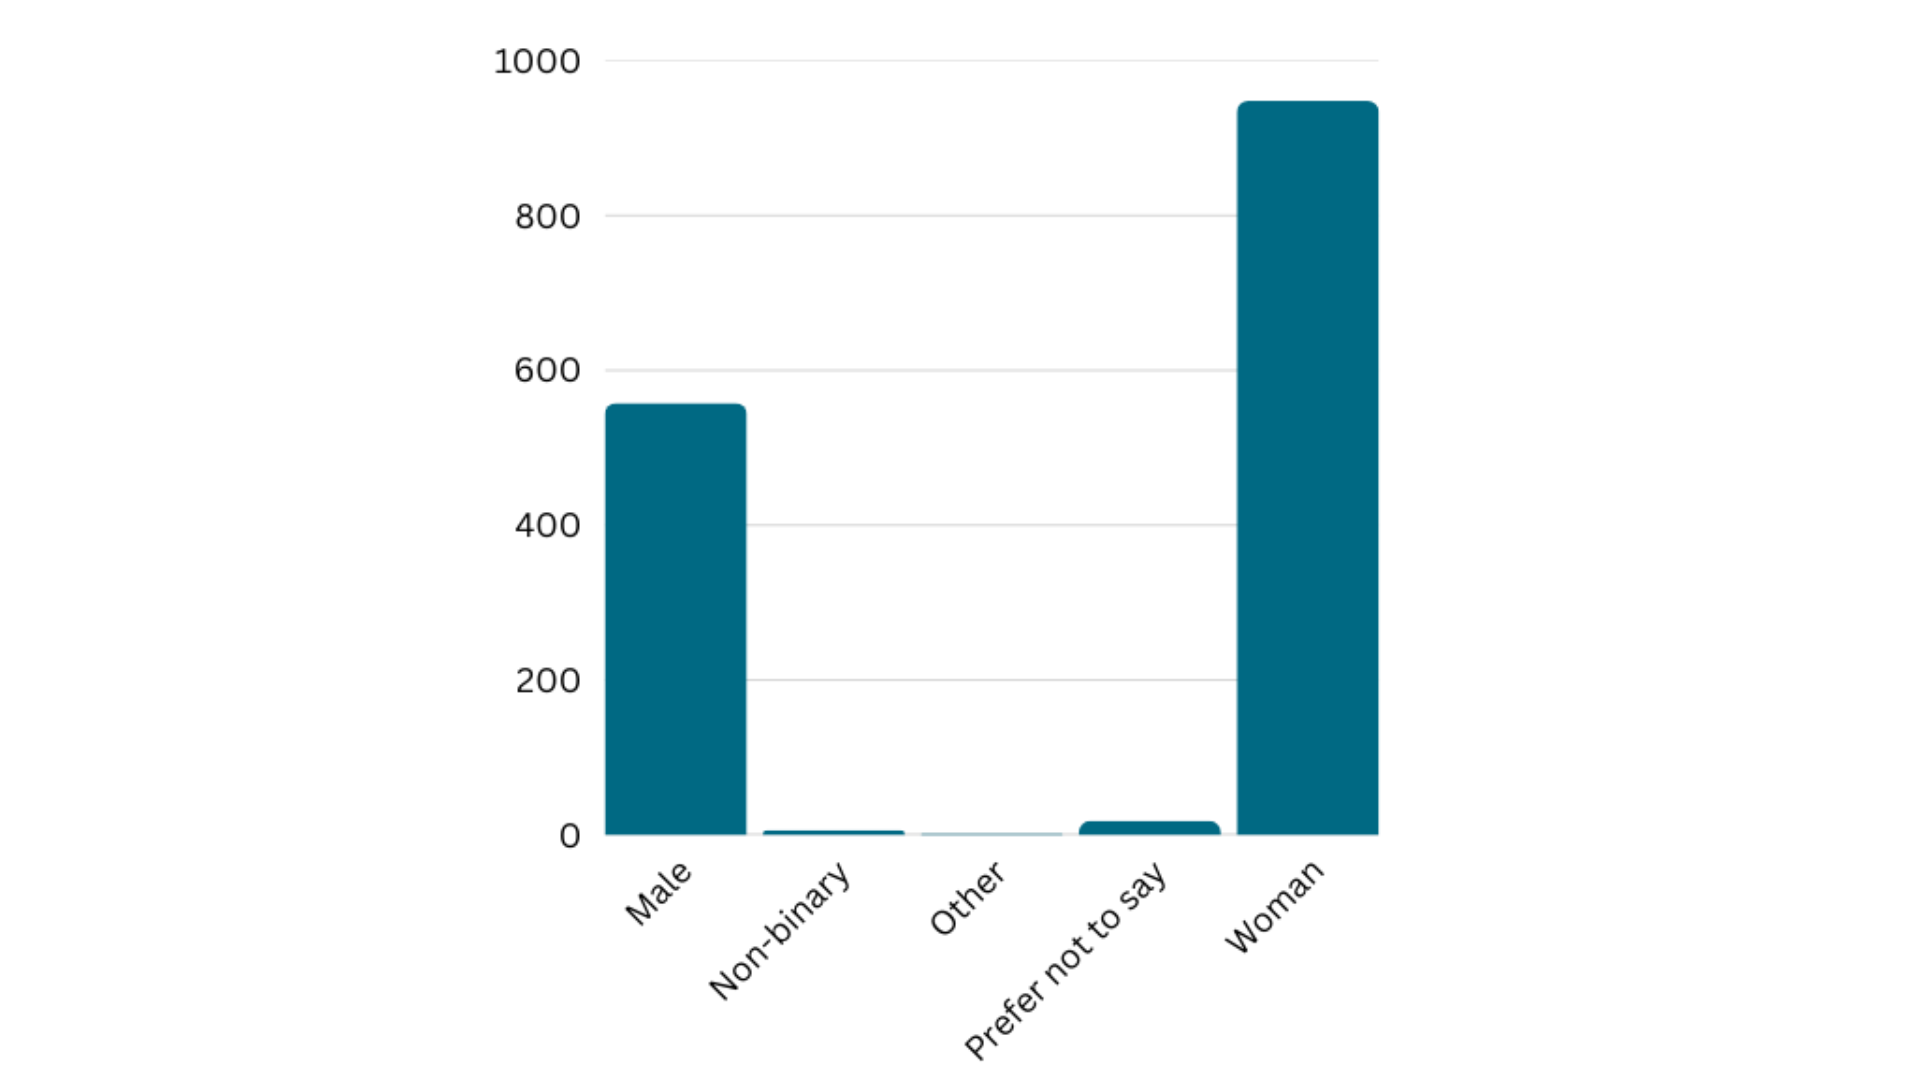
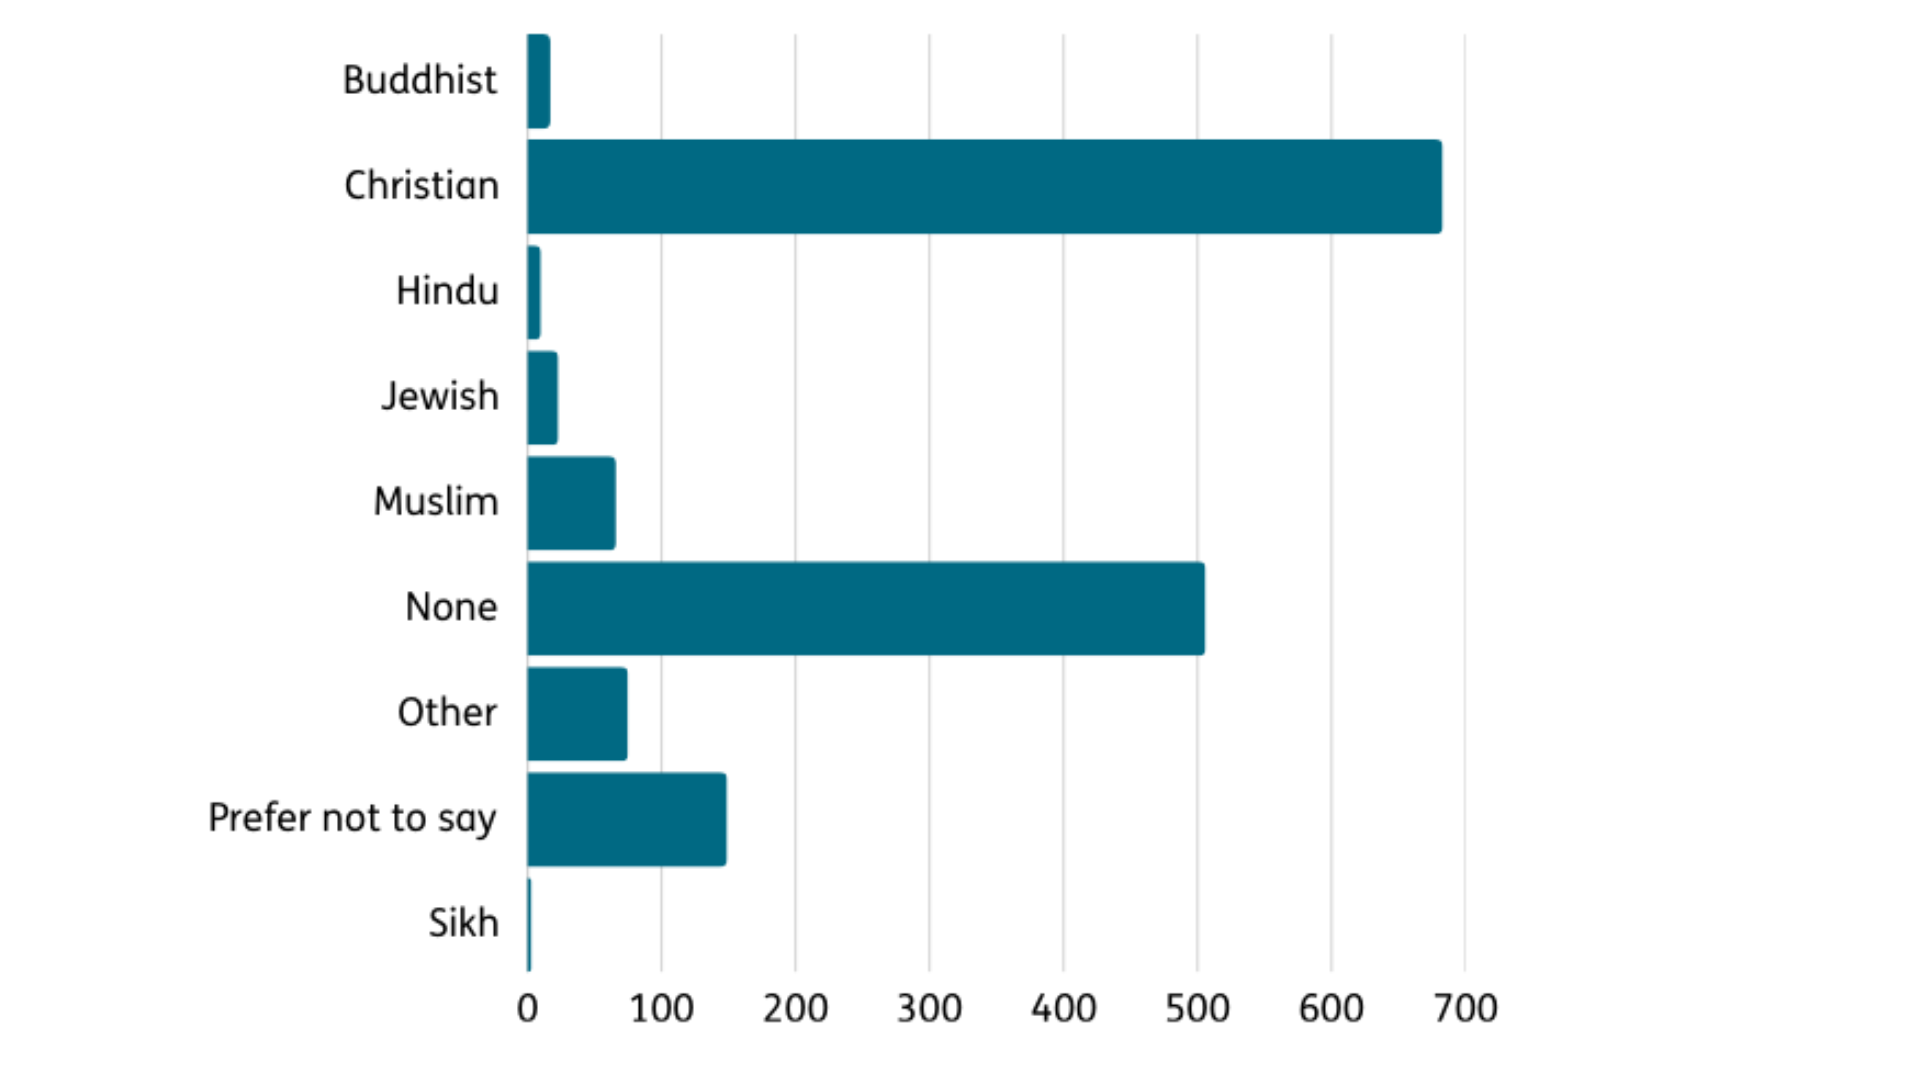
About our members