Q2 and Q3 Quarterly Data 23-24
This page looks at the data from 2 quarters, from July to December 2023. In this period we made 2,514 determinations.
On this page
Complaints received
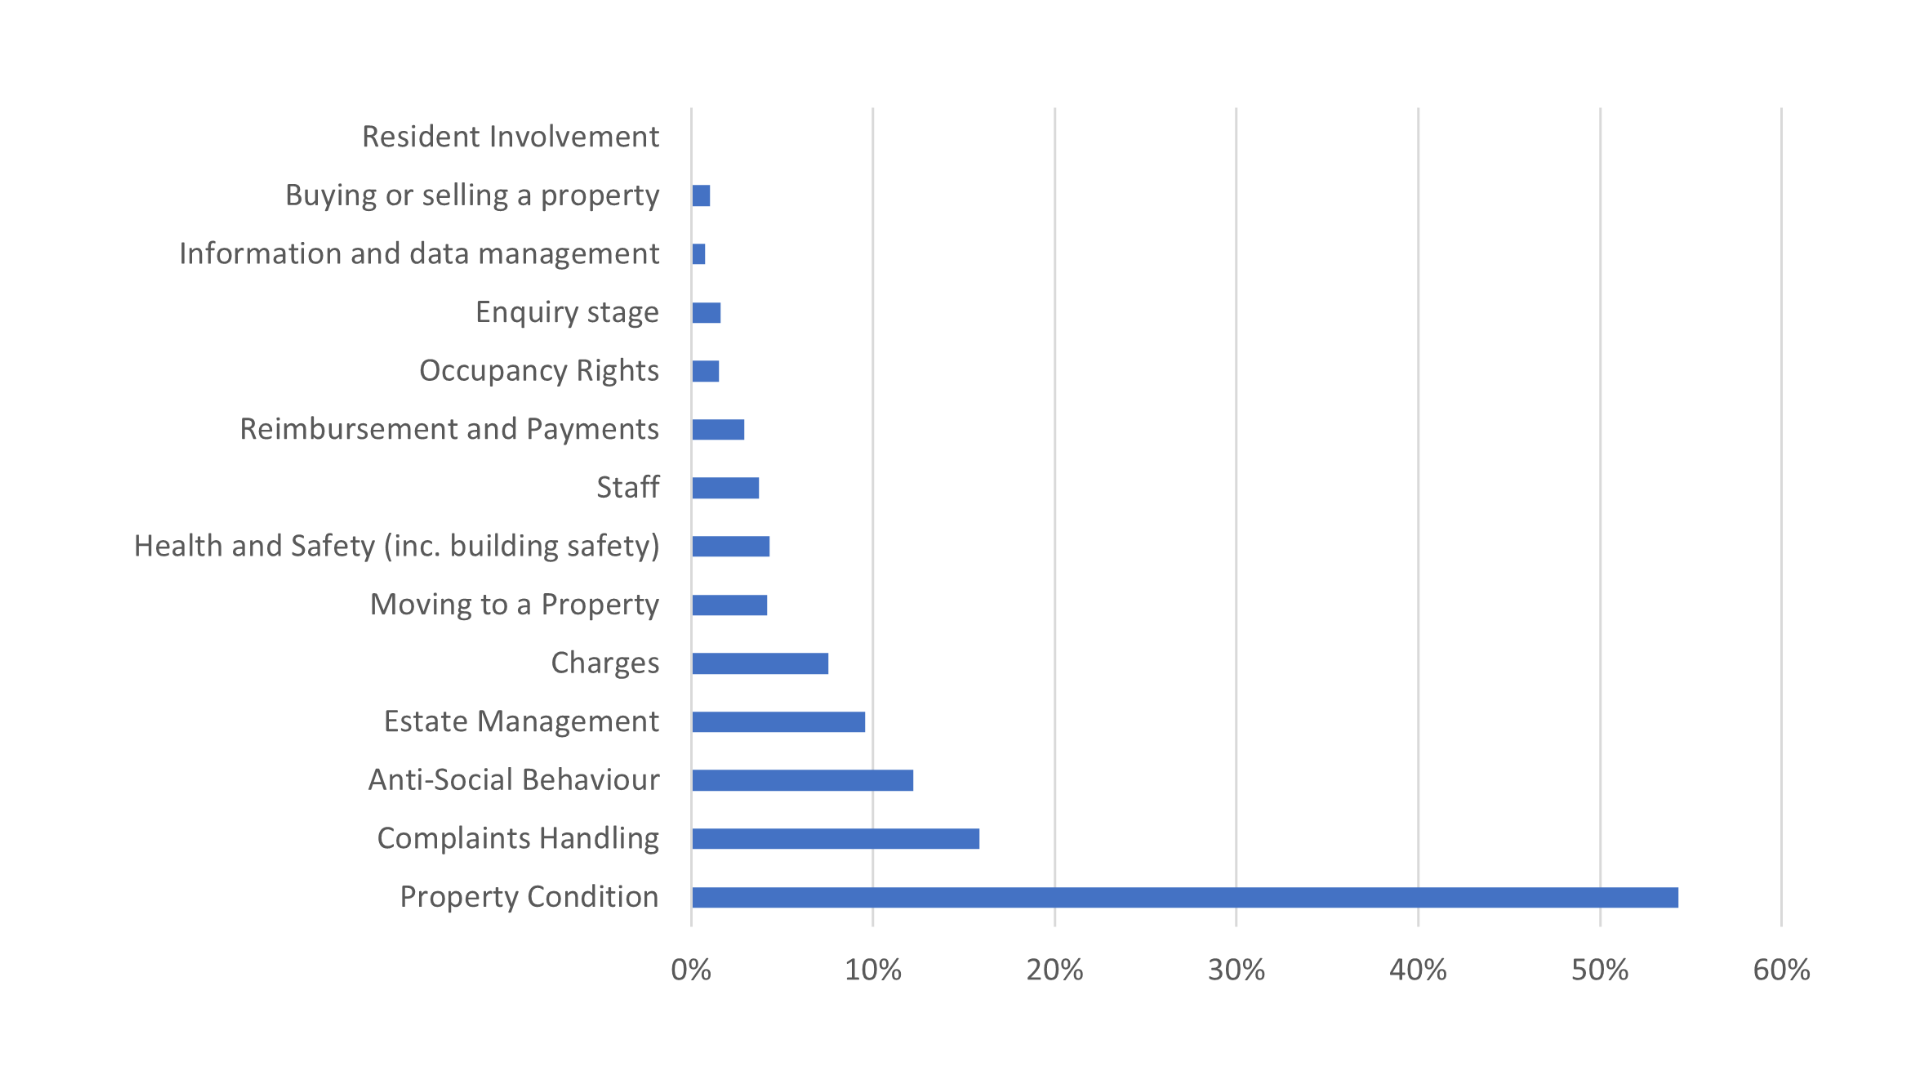
The complaint categories graph shows that ‘property condition’ was once again the most complained about category, with 55% of all complaints. That compares to the second highest ‘complaint handling’, at 16%.
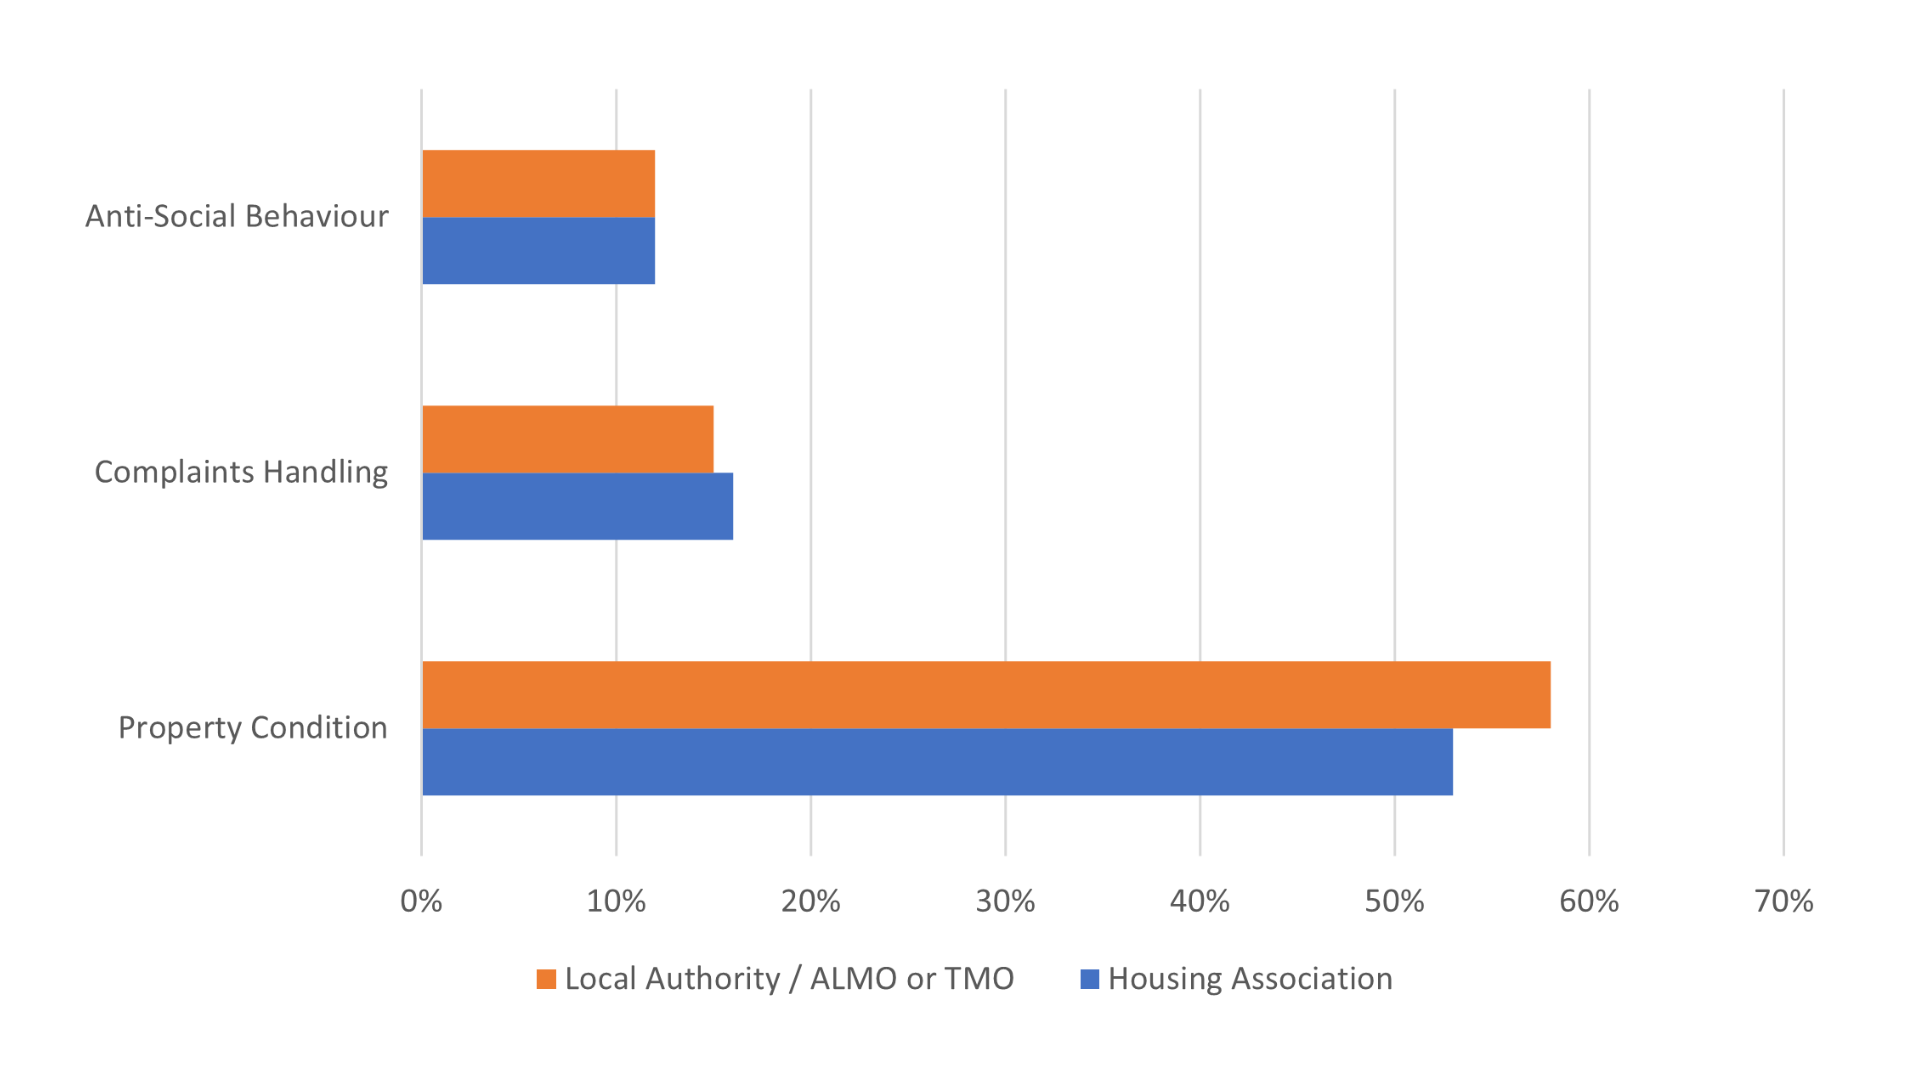
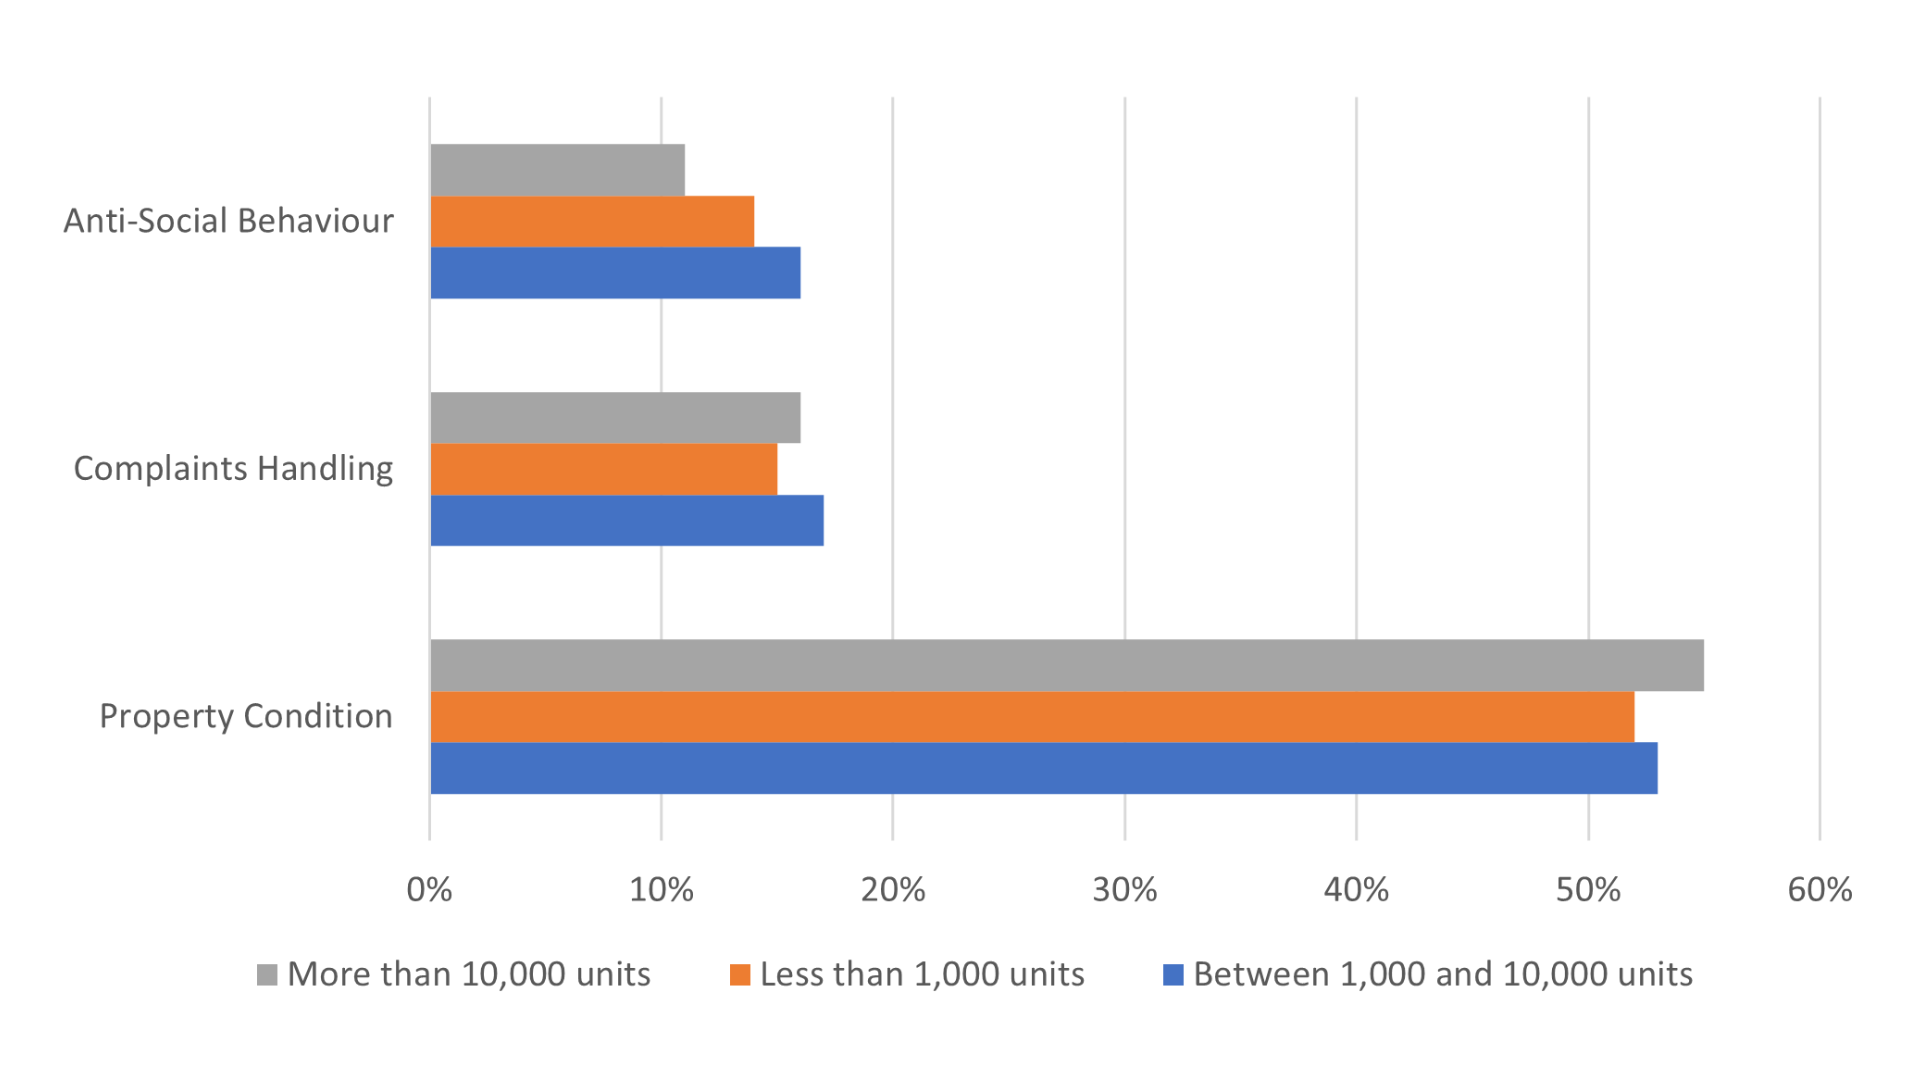
The following 2 graphs show how many complaints we receive from different types of landlords and different sizes regarding the top 3 complaint categories (property condition, complaint handling and anti-social behaviour).
Complaint categories
Type of landlord
Size of landlord
Determinations
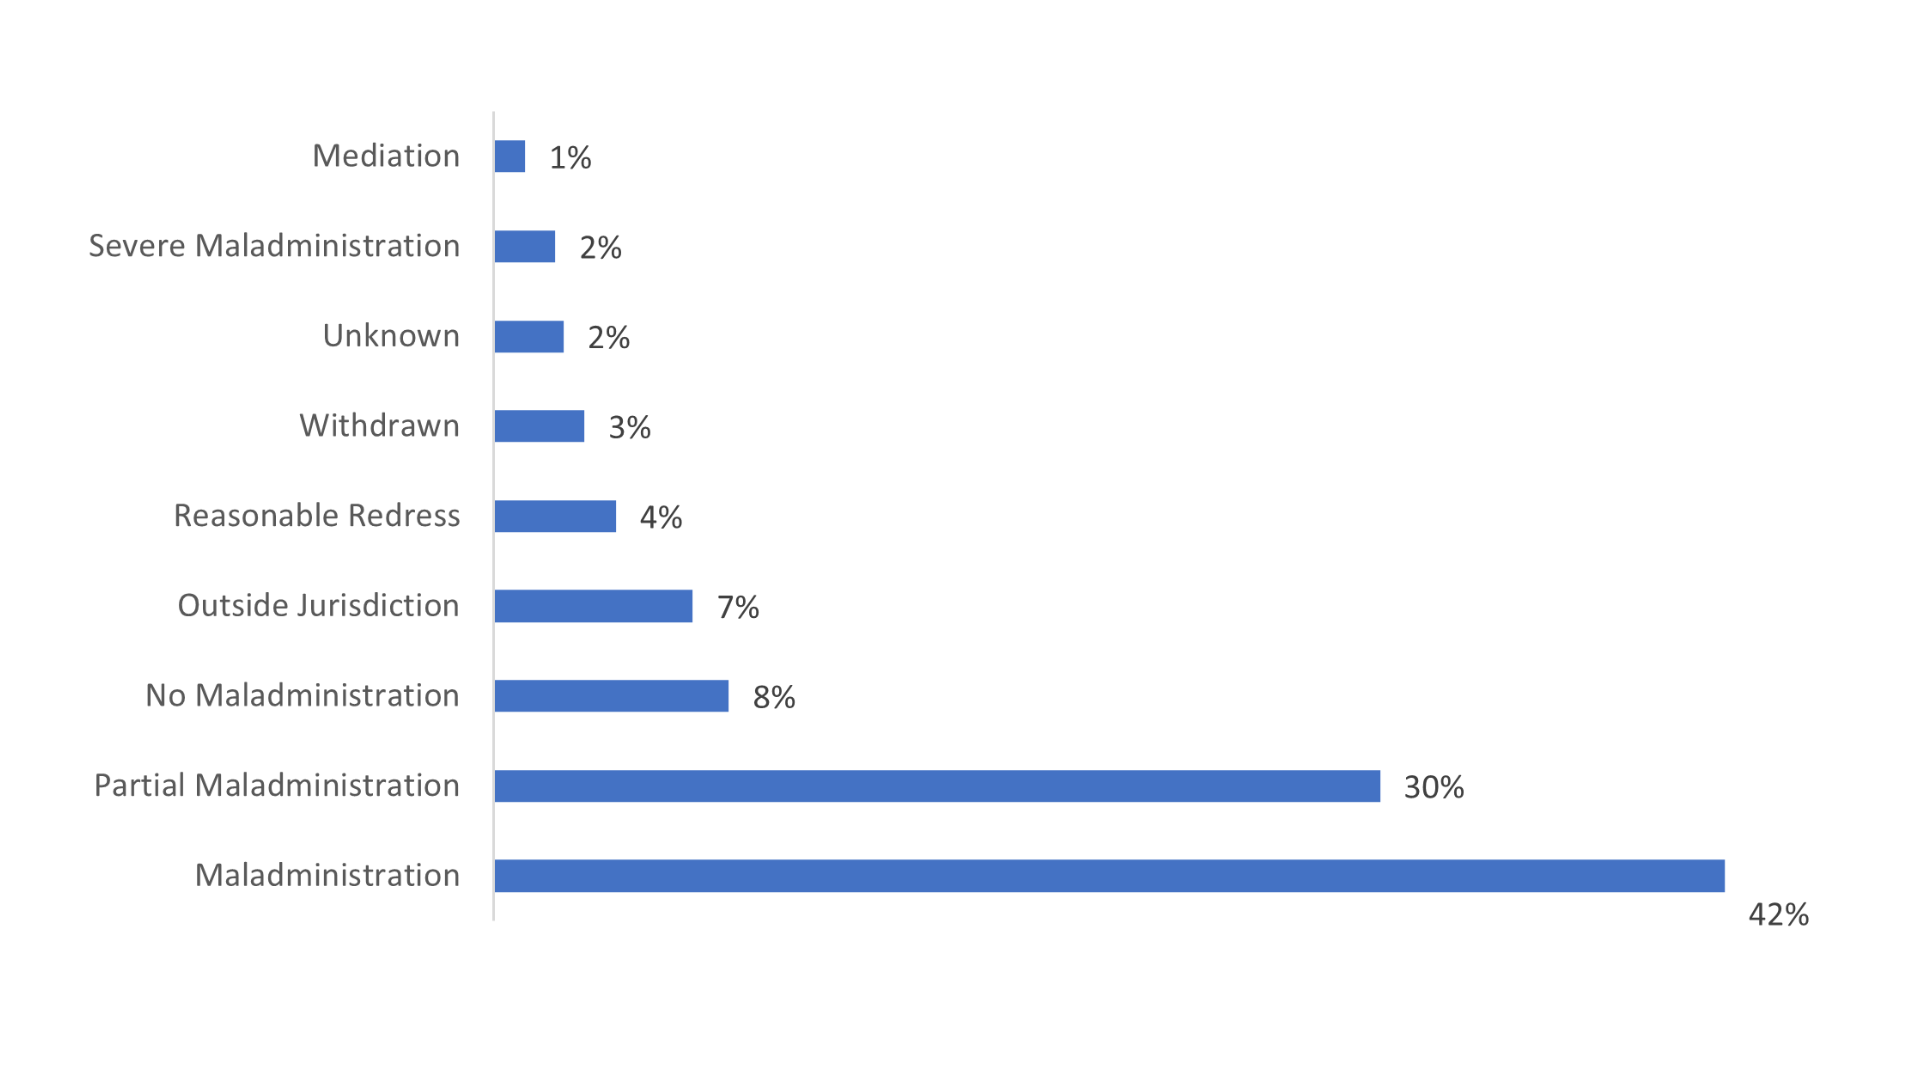
This graph shows how we found maladministration (whether that be severe, partial, or maladministration) in 74% of cases in the quarter.
% of determinations
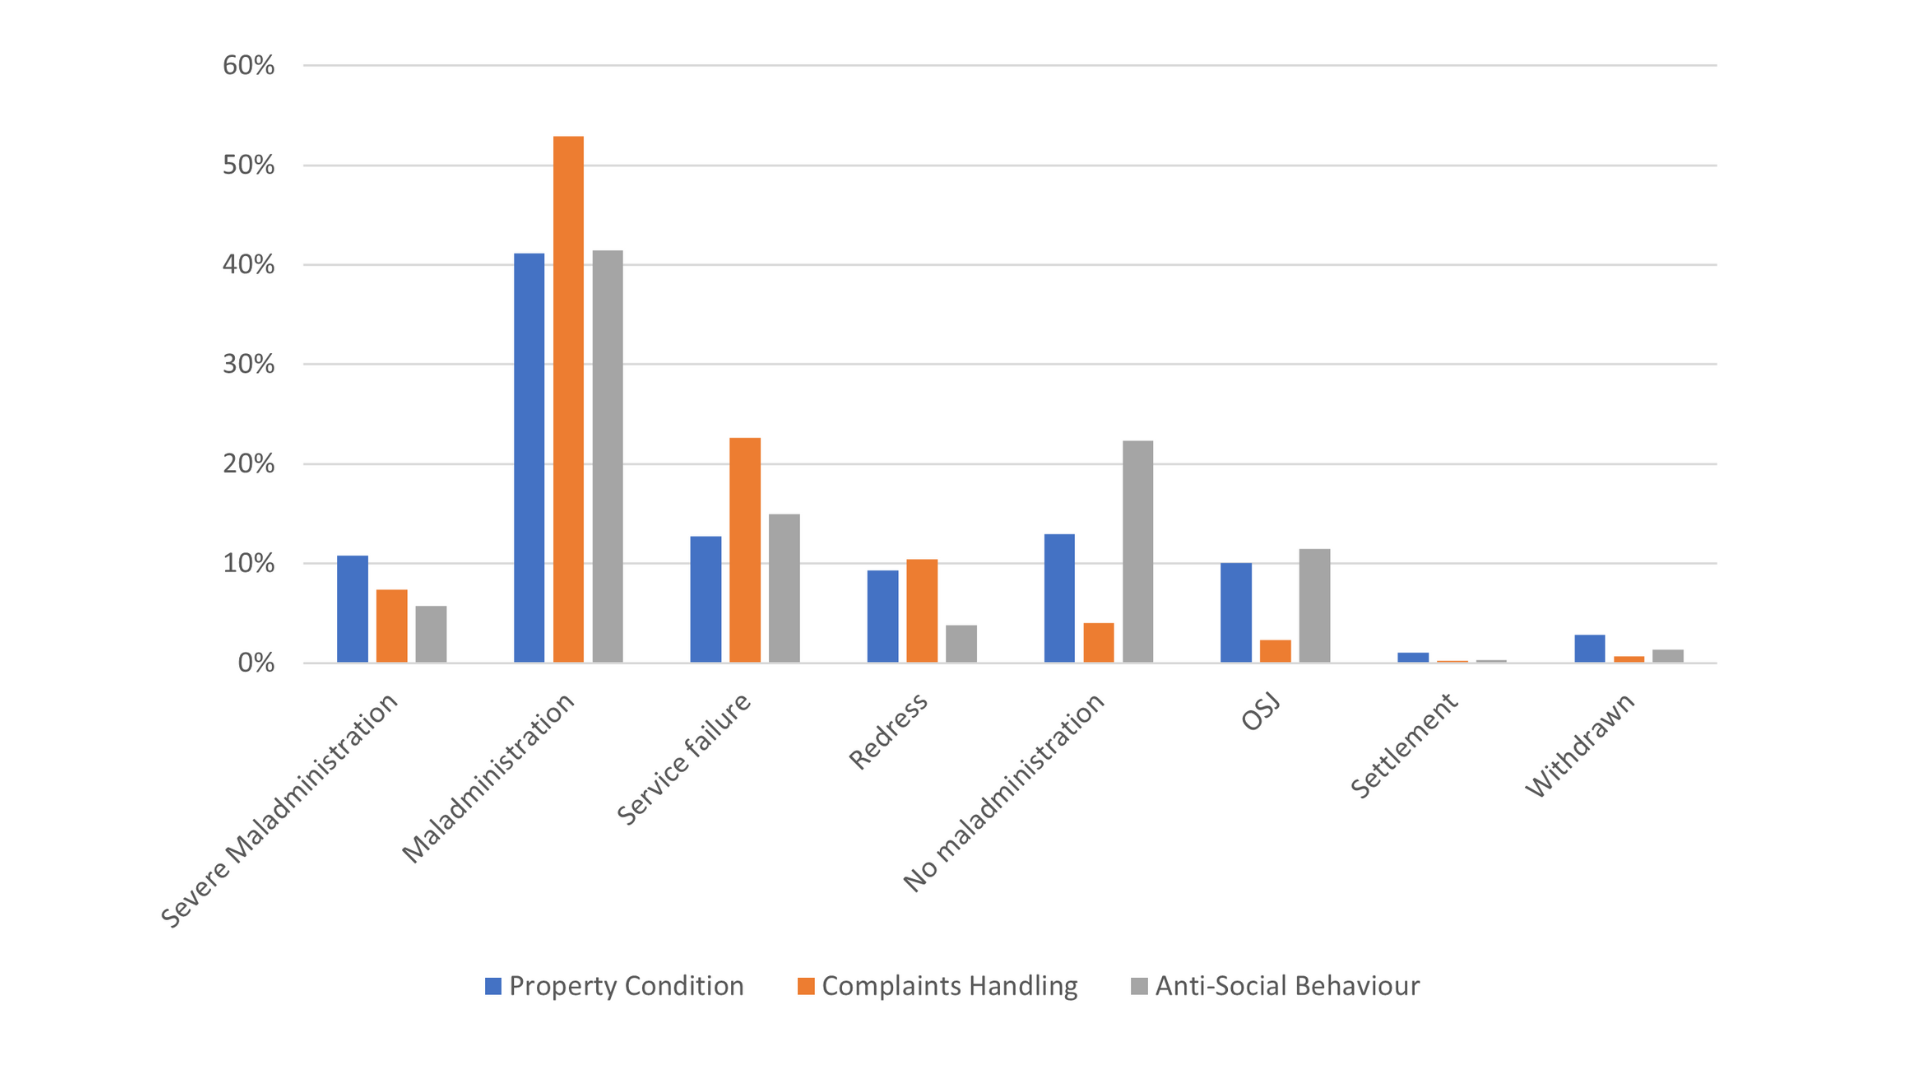
Category findings
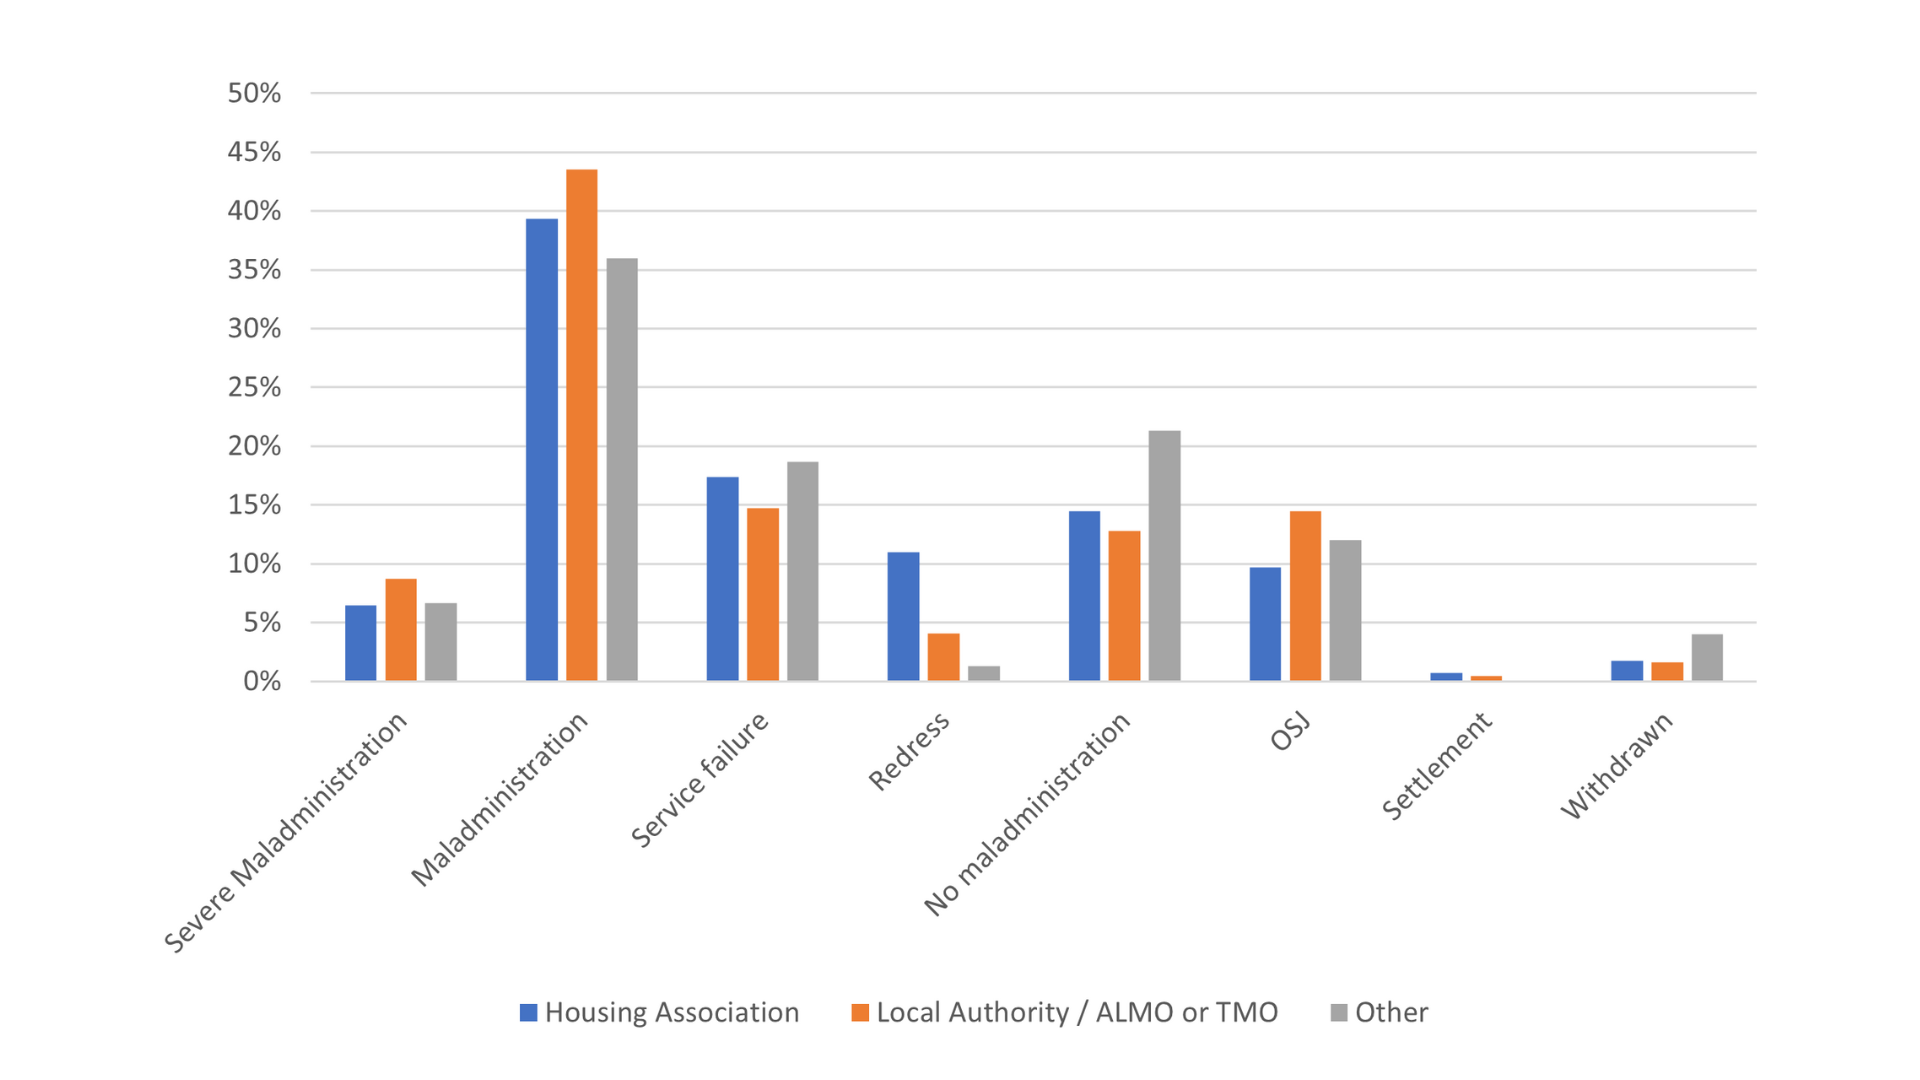
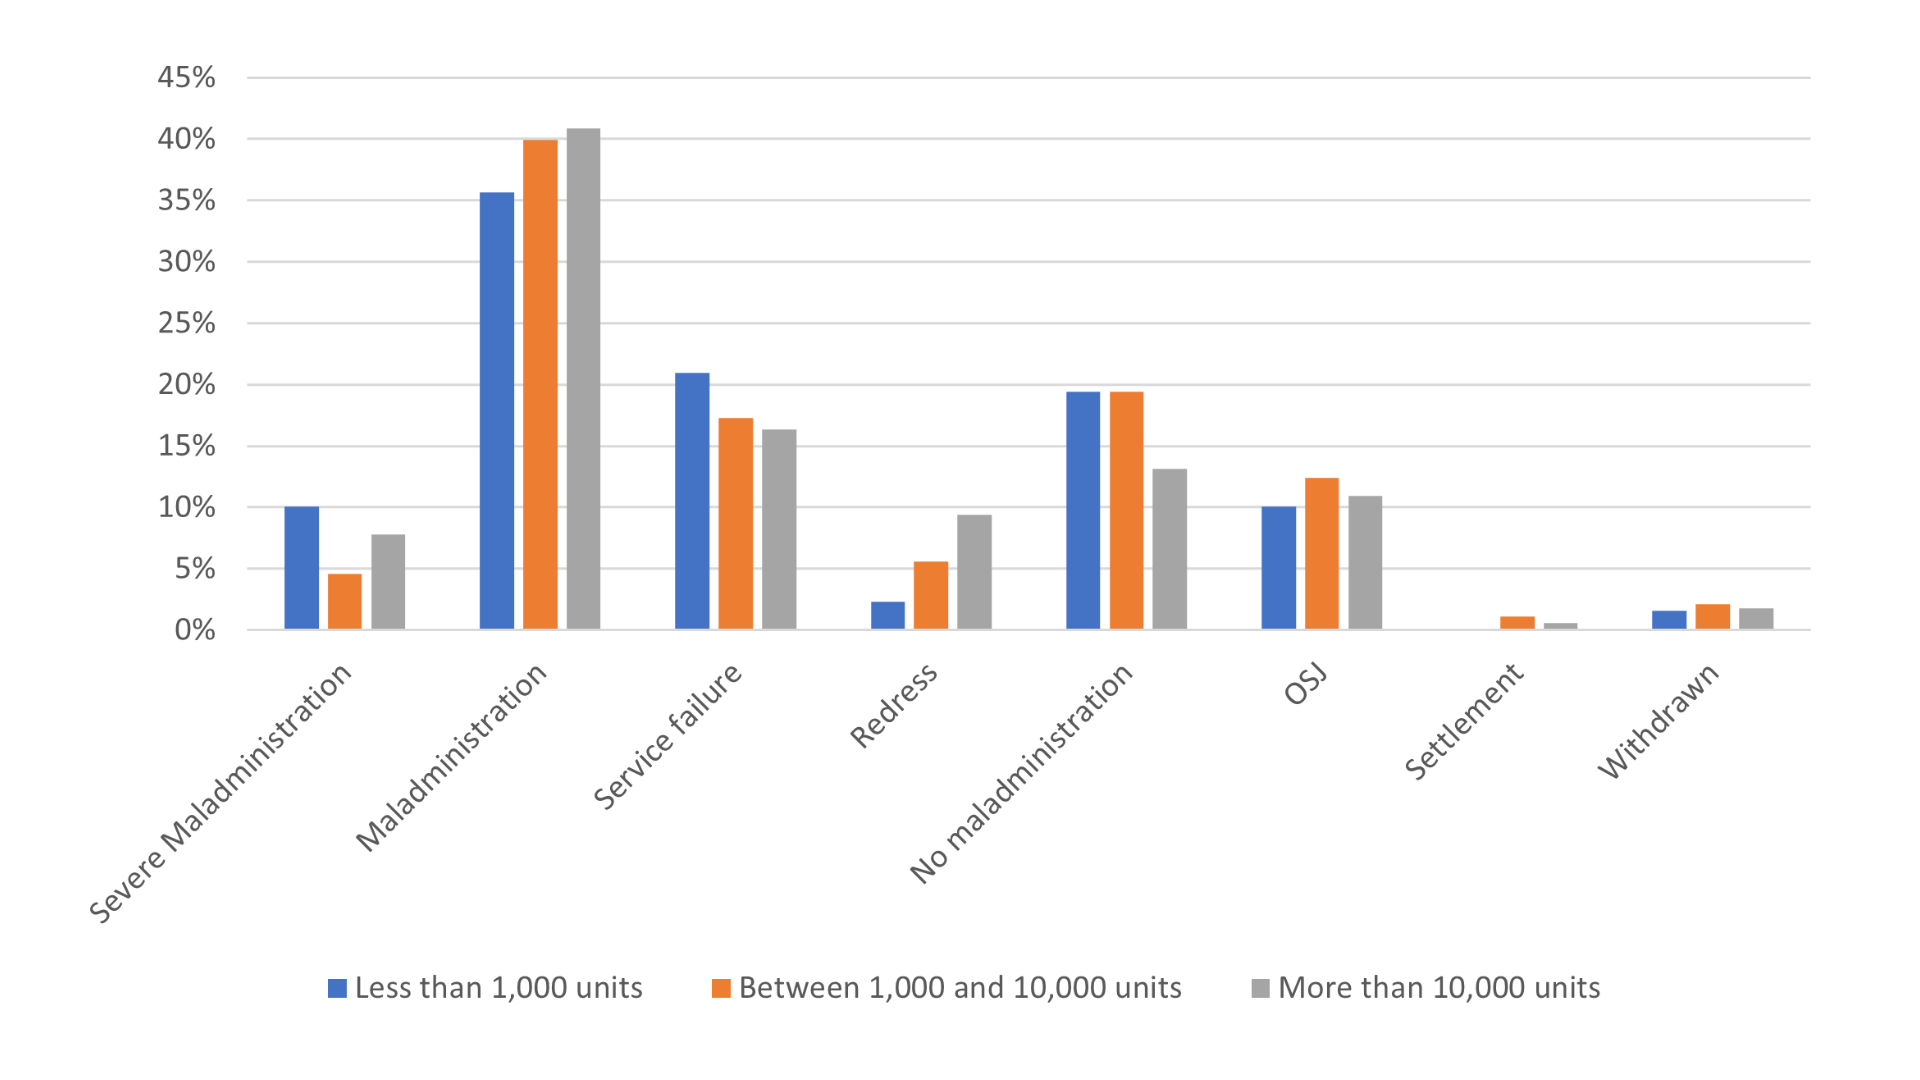
These graphs show how the different category findings relate to the top 3 complaint categories, the different types of landlords, and the different size of landlords.
Different category findings
Type of landlord
Size of landlord
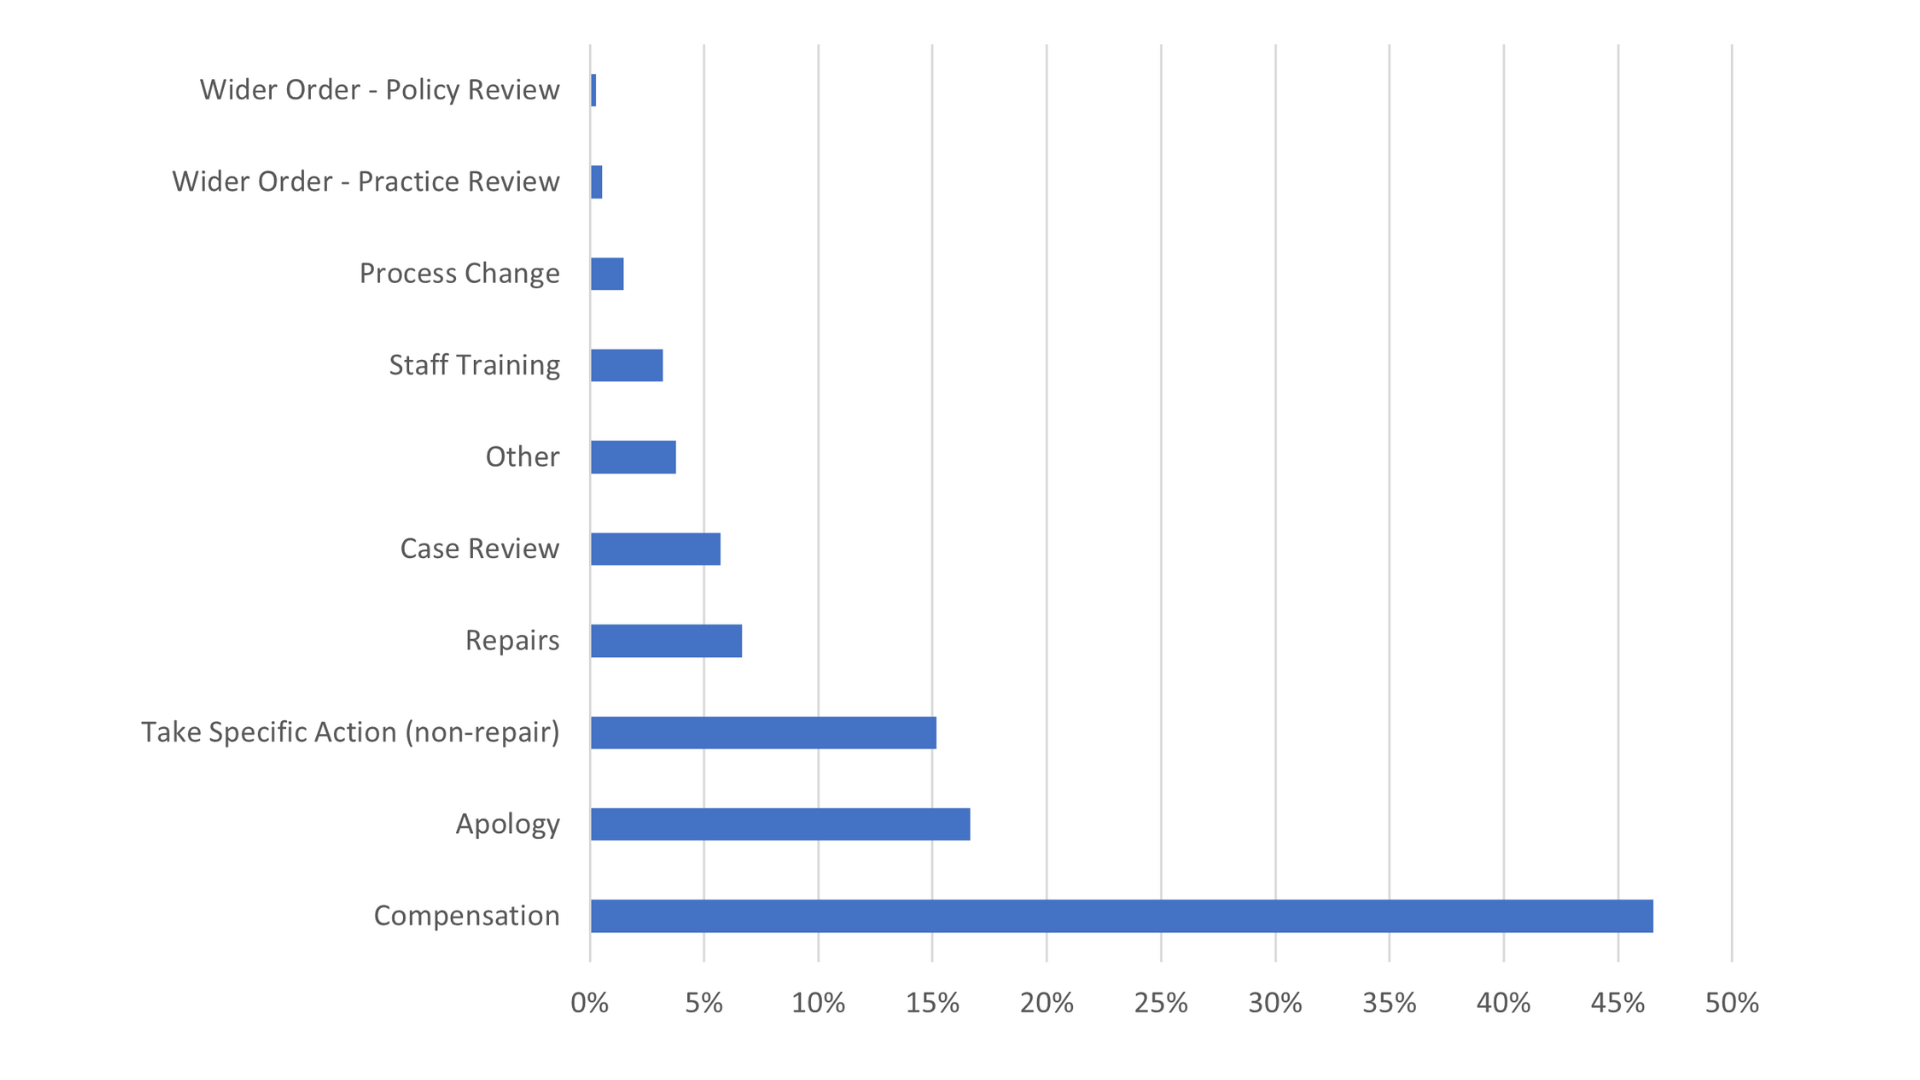
Orders and recommendations
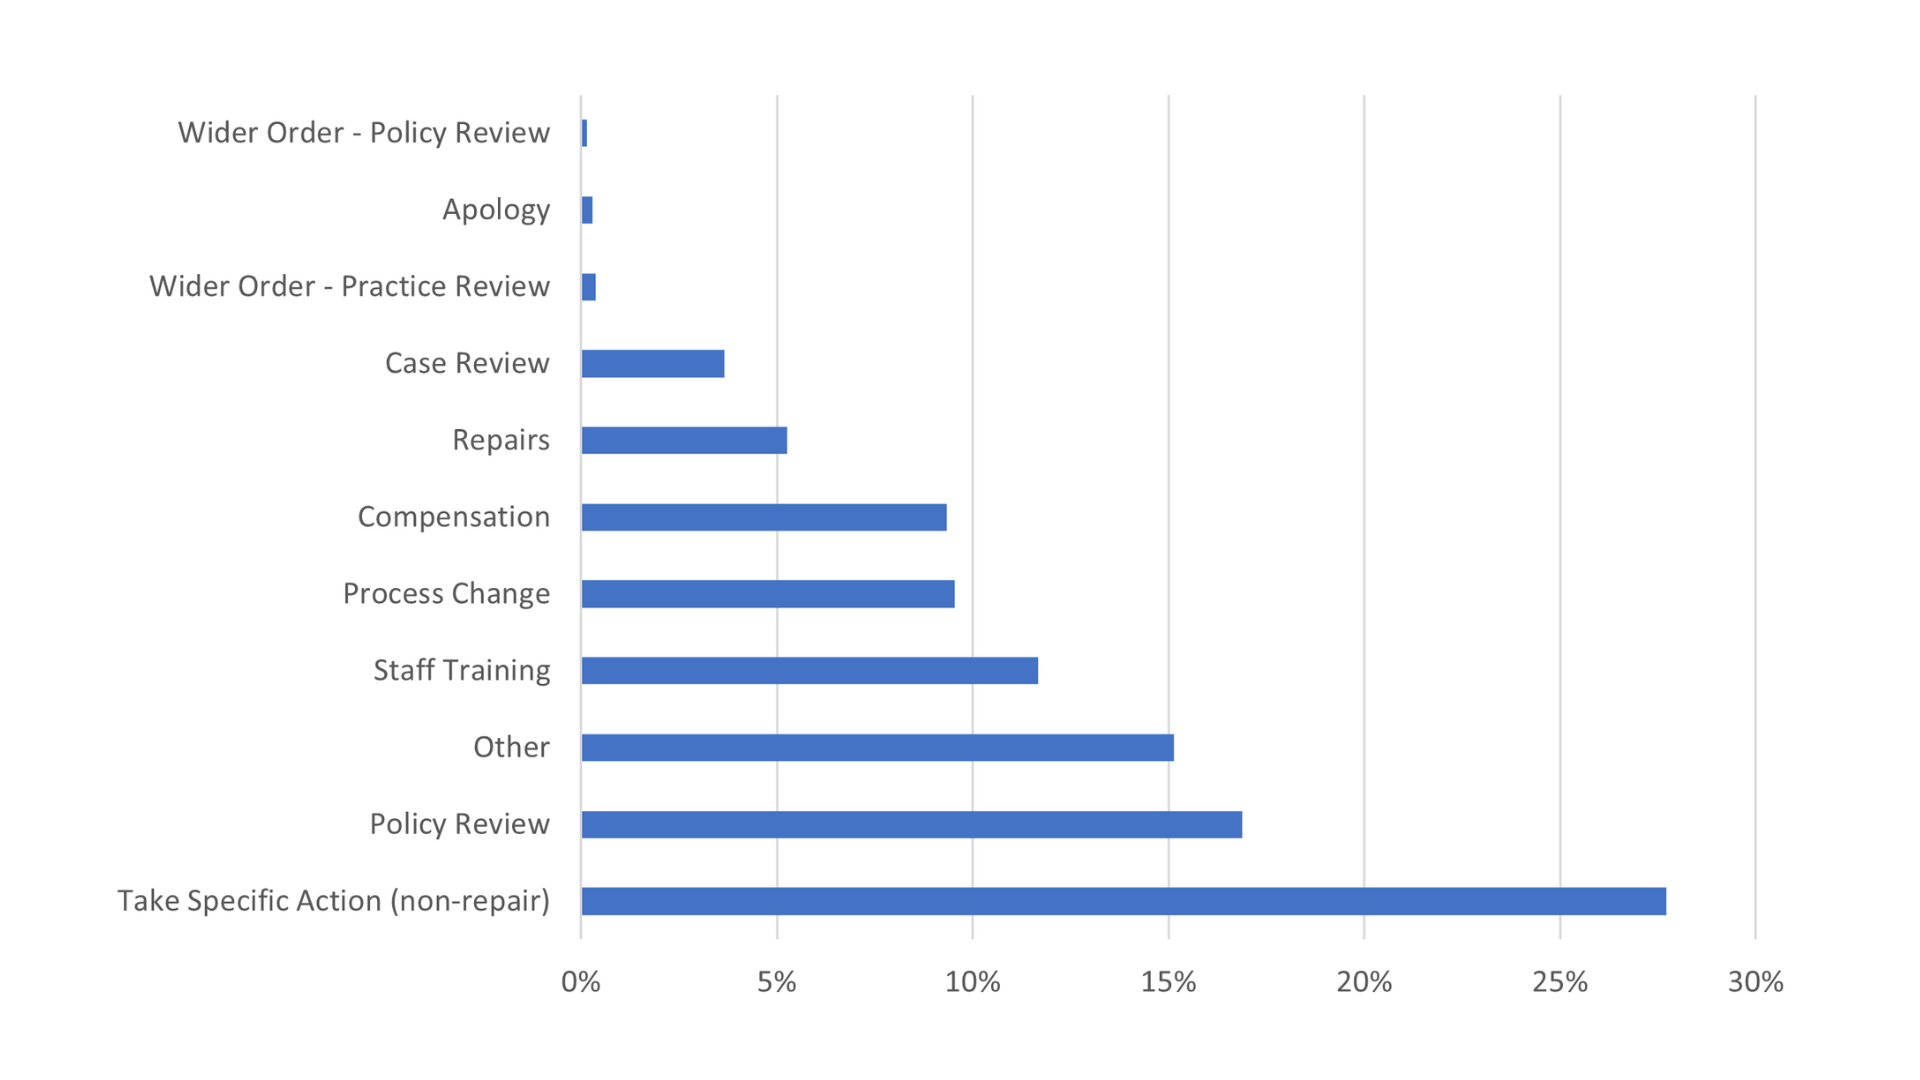
The orders given to landlords graph shows that in 53% of cases, we ordered landlords to pay residents compensation. And the recommendations given to landlord’s graph shows that in 14% of cases, we recommended that the landlord take non-specific action (usually something that is outside a repair).
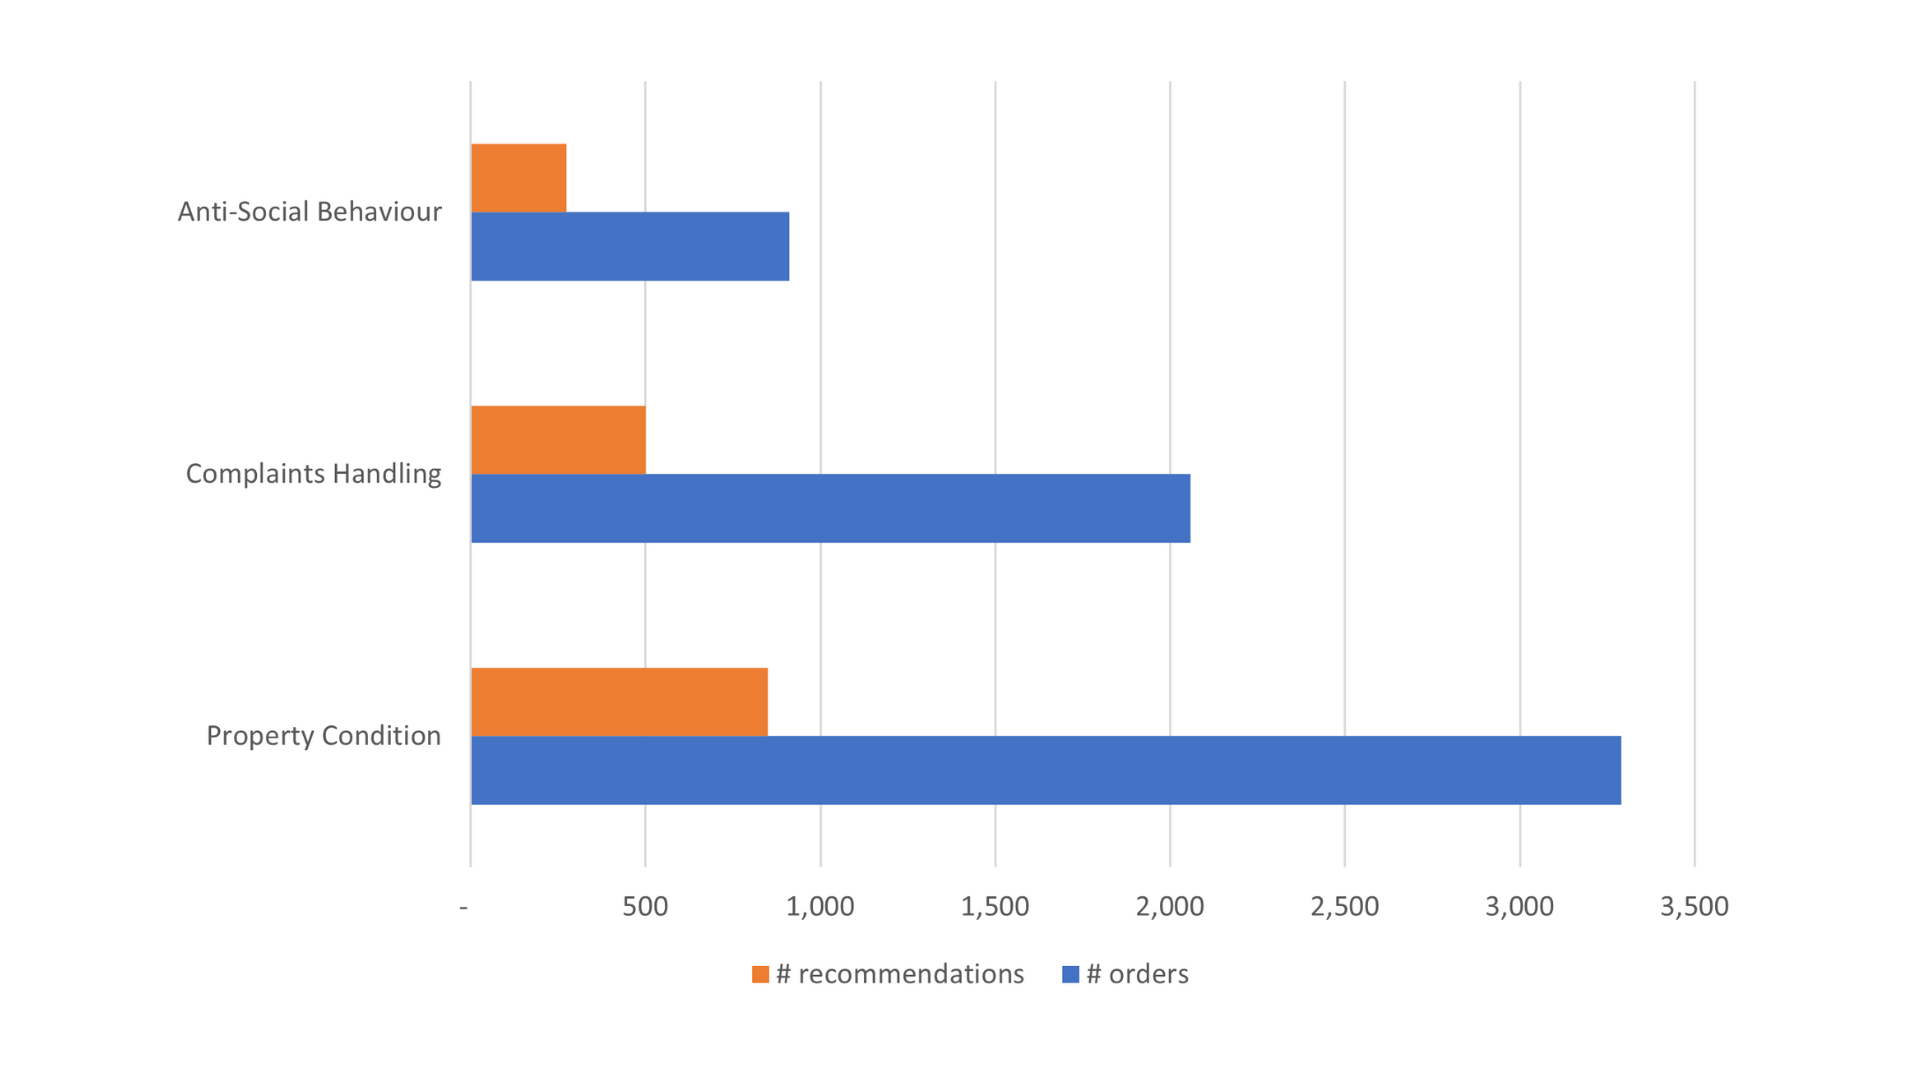
The final graph shows how many orders and recommendations we’ve made based on the top three complaint categories.
Orders given to landlords
Recommendations given to landlords
Orders and recommendations made against top 3 complaints
* All data is provisional and subject to confirmation in the final end-year figures to be published in the annual report.