Annual Complaints Review 2022-23
Our Annual Complaints Review paints a challenging picture of social housing complaints which has seen a huge spike due to poor property conditions, legislative changes, media attention and the inquest into the death of Awaab Ishak.
On this page
This page refers to Complaint Handling Failure Orders (CHFOs), which was our process at the time of publication. We now issue Complaint Handling Failure Notices (CHFNs) in these circumstances. View the latest information on how we bring landlords into compliance in casework.
Introduction
Last year the Ombudsman received over 5,000 complaints that were escalated for formal investigation for the first time. This represents a 27% increase on the previous year. Following the investigations, we undertook in 2022 to 23, we made 6,590 orders and recommendations to make things right for residents. This included ordering or recommending £1.1m in compensation.
The review also reveals an increase in maladministration findings where service requests or complaints were not handled reasonably and a decrease in findings of no fault. Combined, this means more than half of findings were upheld for the first time.
We also share some regional data, showing the areas with the highest and lowest maladministration rates, as well as the issues that are most prevalent in the different regions.
Running alongside the Annual Complaints Review were our landlord and resident surveys. Taken by our Resident Panel and landlords from across the country, the results show an encouraging trend towards promotion of the complaints process, signposting to the Ombudsman and sharing learning from complaints.
Helpful Links
- Landlord performance reports
- Guidance on landlord reports (pdf) ( pdf, unknown MB)
- Landlords with high maladministration findings (Opens in a new tab)
- Letter to 75%+ maladministration rate landlords (pdf) ( pdf, unknown MB)
- Letter to 50-75% maladministration rate landlords (pdf) ( pdf, unknown MB)
- Letter to 0% maladministration rate landlords (pdf) ( pdf, unknown MB)
Performance
The Review reveals a sharp increase in severe maladministration findings, with the number rising from 31 to 131 - a 323% increase.
112 of these 131 findings were for landlords with over 10,000 homes. The split between housing associations and local authorities was proportionate to the number of homes owned in each landlord type.
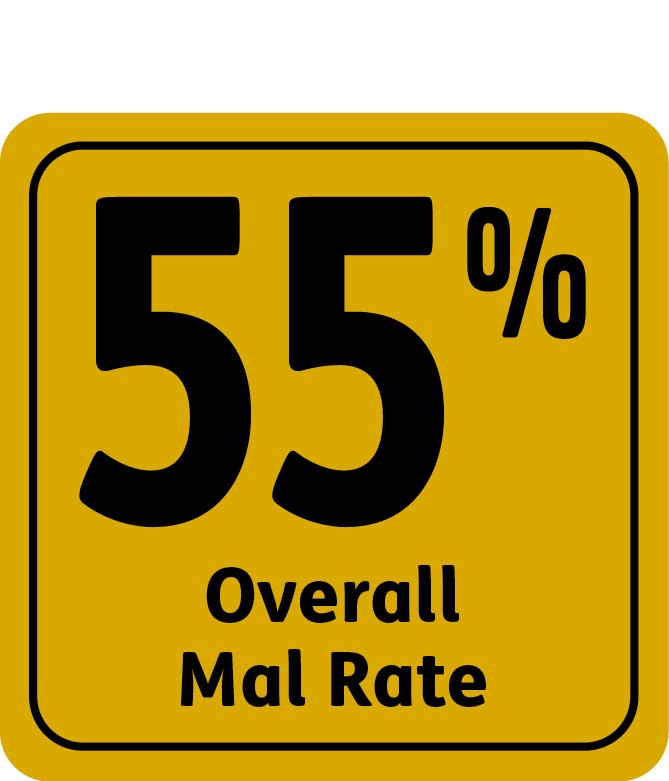
We made 2,430 maladministration findings - an increase of 40% on the previous year. This has seen the maladministration rate as a whole go from 43% to 55%.
Quarterly increases
And we found that this increase was happening quarter on quarter throughout the year:
- Quarter 1 - 48% maladministration rate
- Quarter 2 - 51% maladministration rate
- Quarter 3 - 55% maladministration rate
- Quarter 4 - 61% maladministration rate
The rate for local authorities was slightly higher than housing associations, 62% compared to 50%. We have found that due to less resource, it is harder for local authorities to offer reasonable redress to therefore ending up with more maladministration findings. Size made little difference unless the organisation was very small.
Additionally, the number of no maladministration findings that we made dropped by 20%, from 1,481 to 1,192.
Categories
Once again, our main complaint type was property condition and we made nearly 2,000 findings on this alone. This accounted for 37% of all the findings we made last year.
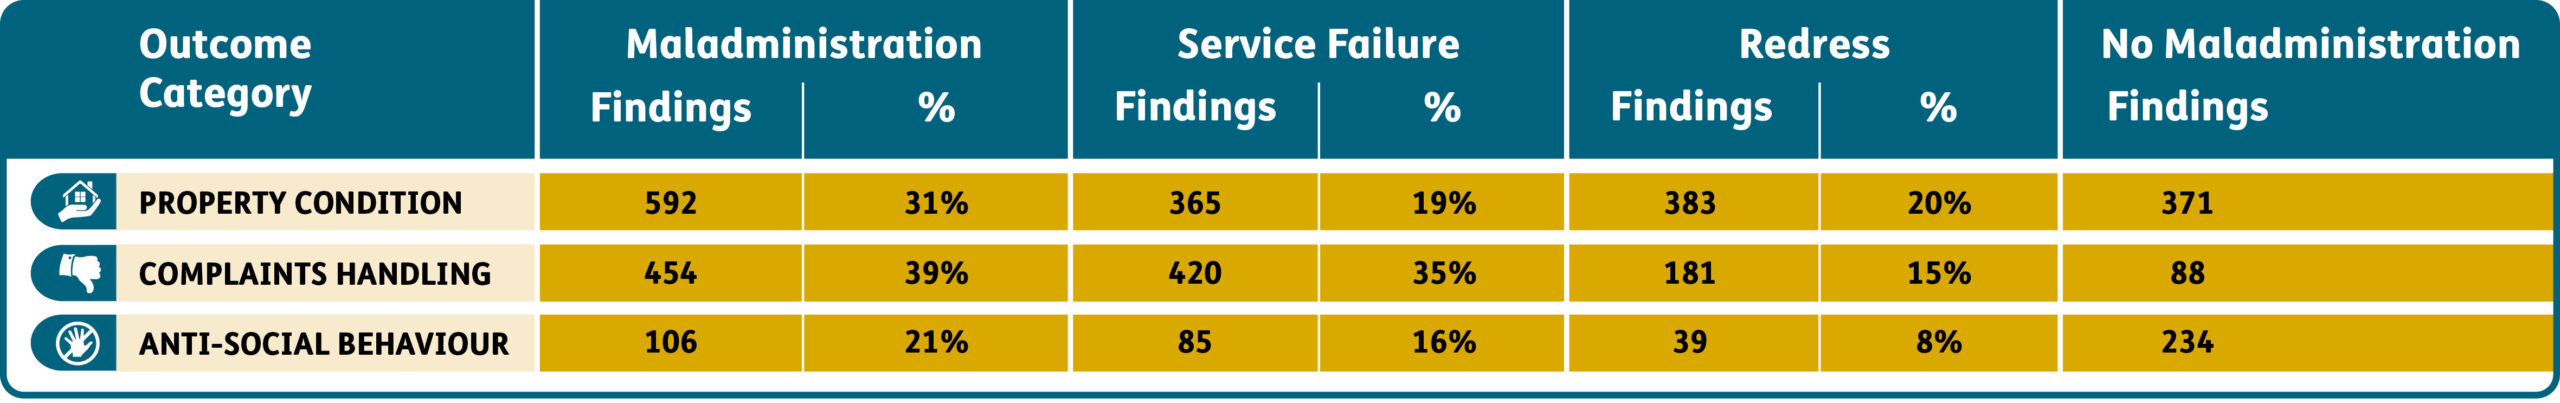
We also saw a sharp increase in the maladministration rate in property condition, going from 39% to 54%.
Complaints handling was our second largest category of complaint and had a 76% maladministration rate. Other key categories within our data were a 52% maladministration rate for health and safety complaints, which includes building safety.
And, after our focus on it as part of our Spotlight report earlier this year, knowledge and information management complaints had a maladministration rate of 79% and the highest severe maladministration rate, which reinforces our eagerness for landlords to adopt the recommendations in our report to drive service delivery.
Complaint Handling Failure Orders
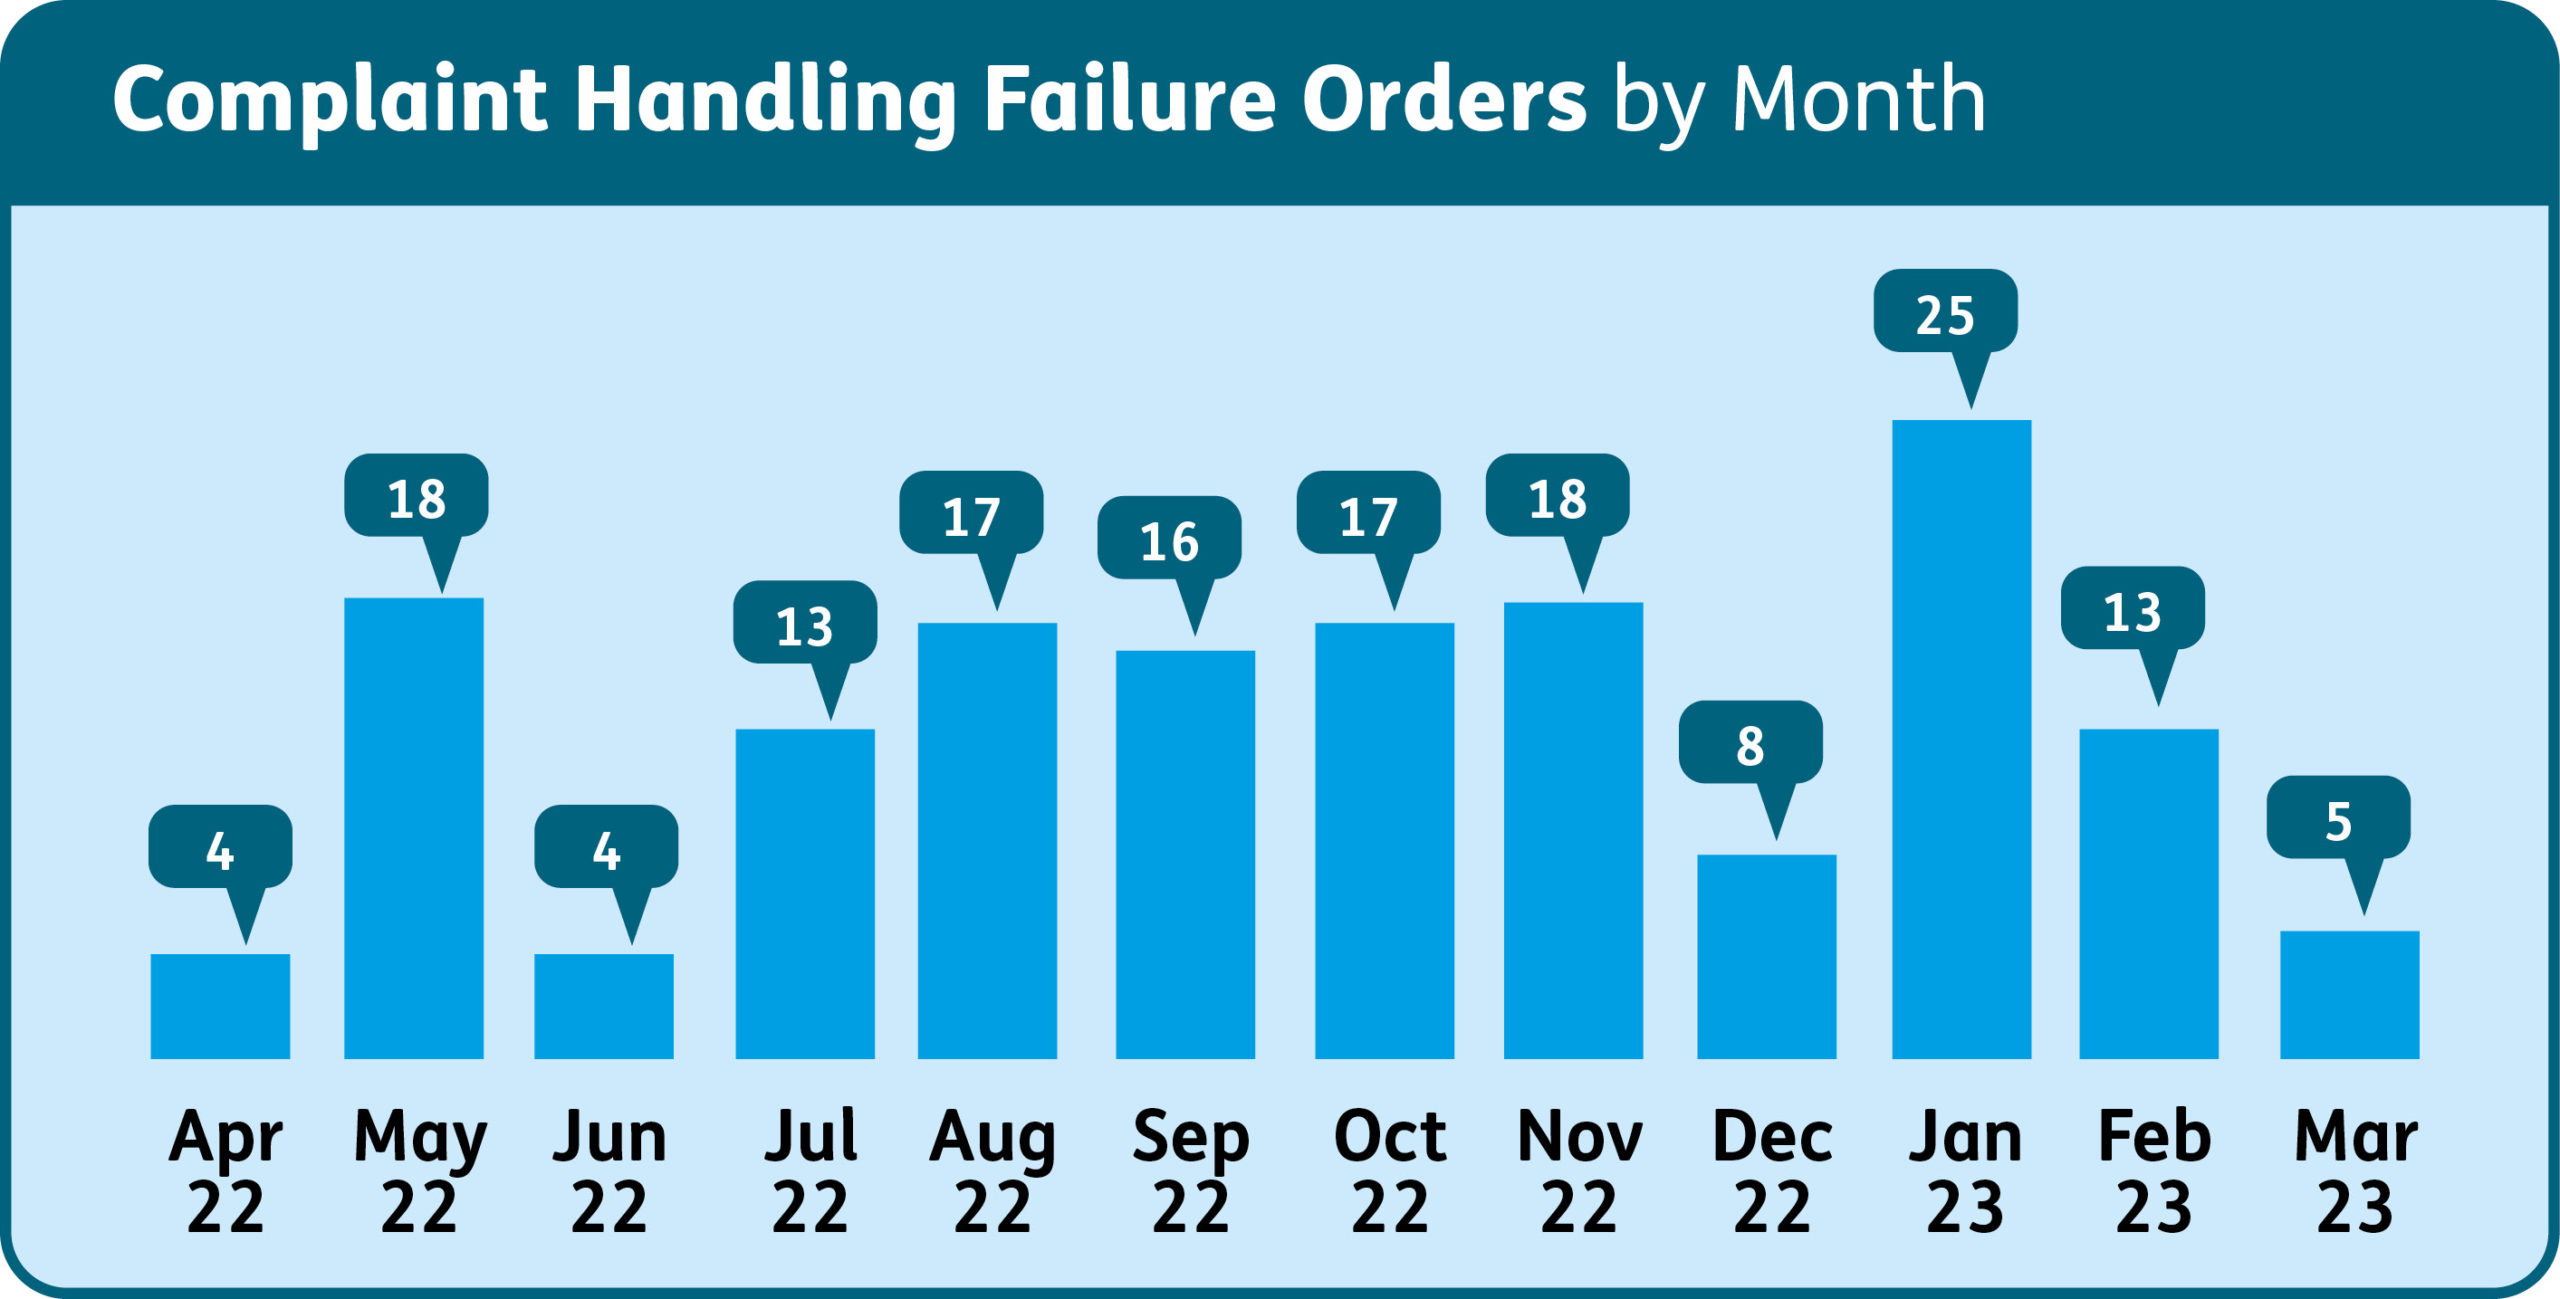
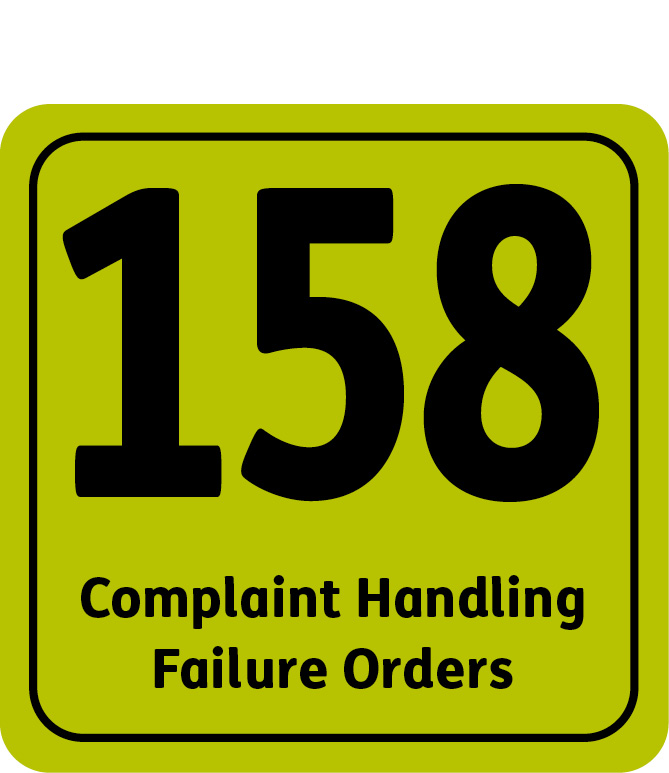
We issued 146 Complaint Handling Failure Orders (CHFOs) in 2022-23 in which 73% were for landlords with 10,000 or more homes. The type of landlord made no difference with 49% being for housing associations, 47% being for local authorities and 4% being others such as for-profit providers.
You can find out more about the work that we do with CHFOs in our Complaint Handling Failure Order quarterly reports.
Individual landlord performance
We found 91 landlords with a maladministration rate of over 50%, with 25 of these having a maladministration rate of over 75%.
The Ombudsman has again written to Chief Executives of landlords who have a maladministration rate of over 50% to bring urgent attention to the figures. You can find a list of those high maladministration landlords here.
Recognising positive complaint handling
However, this year the Ombudsman is also writing to five landlords who had no findings upheld, recognising their positive complaint handling approach. These are Housing 21, Thirteen Housing Group, Unity Housing Association, Beyond Housing and Saffron Housing Trust.
See the Helpful Links section for more information.
Regional data
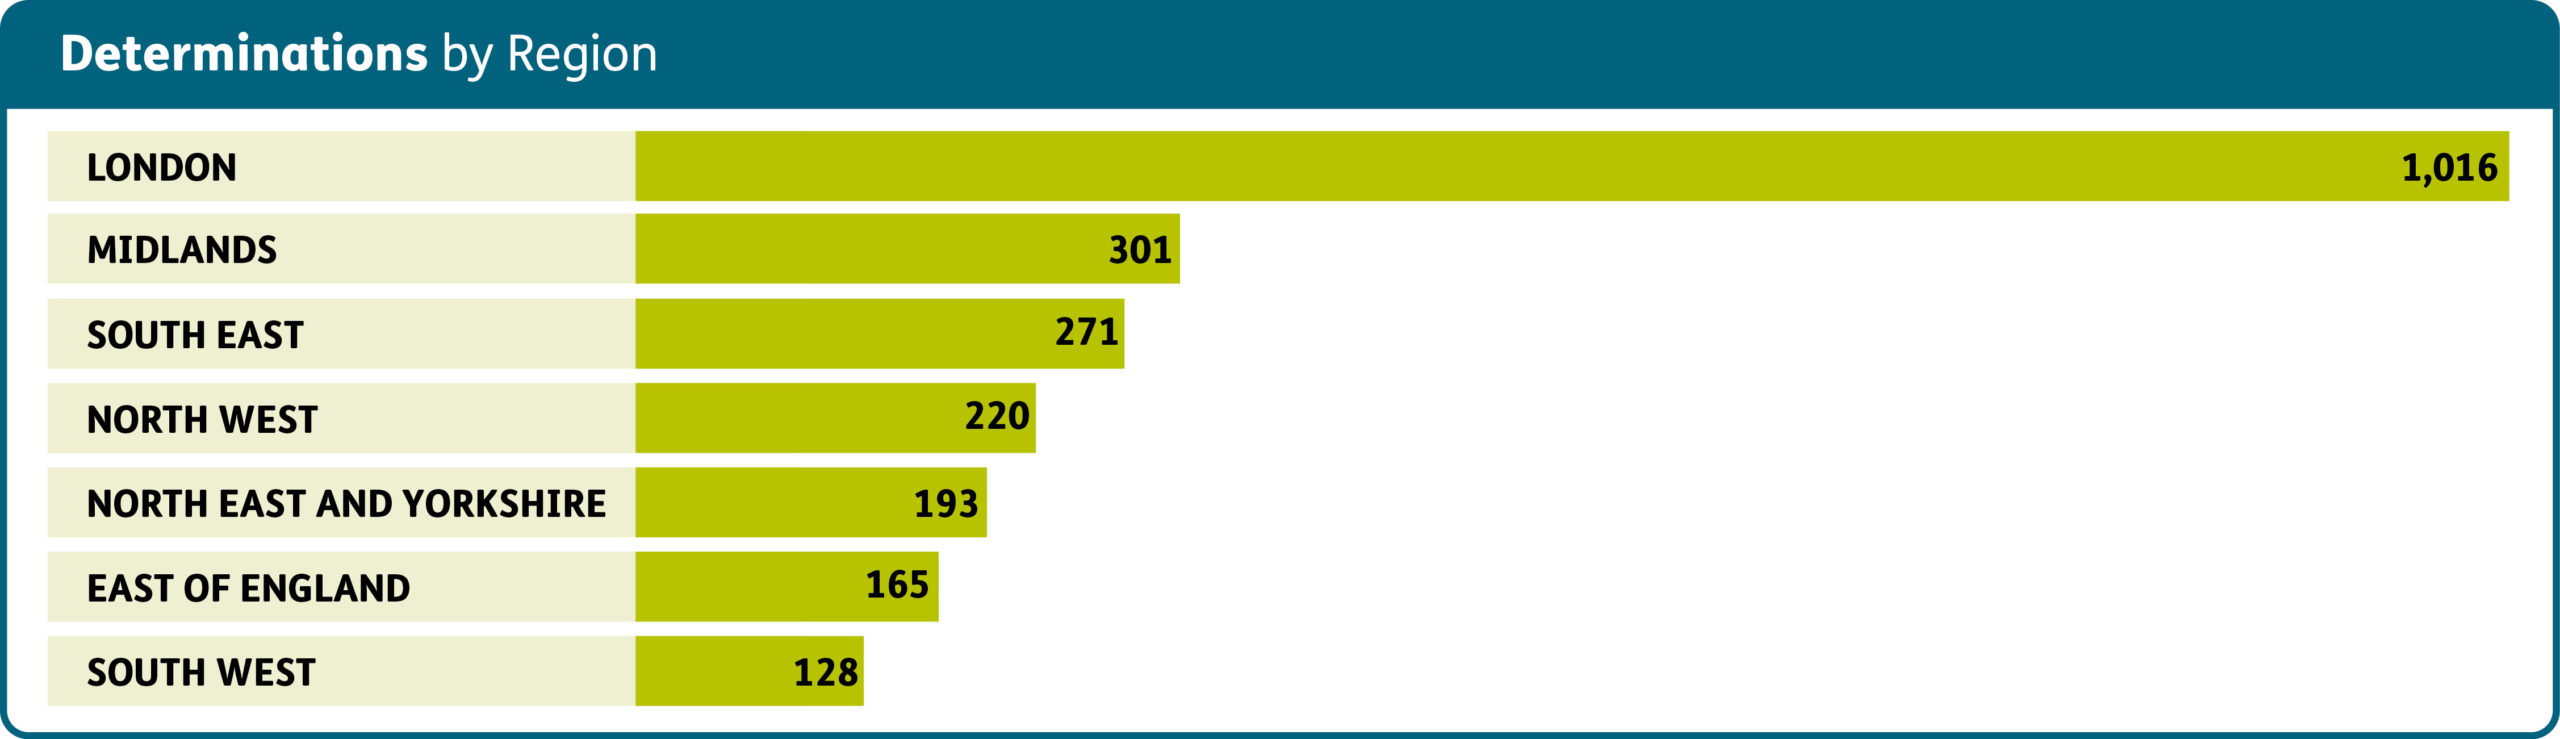
The Annual Complaints Review once again shows that London has the highest number of determinations, even accounting for quantity of housing stock in region.
The region also has the highest maladministration rate at 58% and has the highest maladministration rate for property condition at 58%.
Out of the 131 severe maladministration findings we made last year, 77 of these were for London landlords.
The picture outside London
Although the Midlands was the second highest number of determinations made, the maladministration rate for that area was lower than East of England and the South East.
The North East and Yorkshire had the lowest number of determinations per 10,000 homes and had the lowest maladministration rate for property condition with 47%.
The region also had a noticeably lower maladministration rate for antisocial behaviour complaints with 23% instead of most of the other regions ranging from 30%-52%.
The South West had the lowest maladministration rate of all the regions at 45% and significantly lower maladministration rate for health and safety complaints at 29% (compared to other regions which were 40%-60%).
However, the severe maladministration rate was the second highest.
The North West sat in the middle of the regions, with an overall maladministration rate of 48%.
| London | South East | South West | East of England | Midlands | North West | NE & Yorkshire | |
| Maladministration | 58% | 50% | 45% | 56% | 51% | 48% | 47% |
| Property condition | 62% | 50% | 49% | 58% | 51% | 46% | 51% |
| Antisocial Behaviour (ASB) | 48% | 36% | 38% | 50% | 30% | 47% | 36% |
| Severe maladministration | 3.7% | 1.6% | 3.3% | 1% | 2.2% | 1.6% | 0.6% |
Landlord/resident survey
Overall, residents reported similar satisfaction levels with landlords' complaints process since the same survey was sent to our Resident Panel last year.
But there were improvements in terms of signposting to the Housing Ombudsman, learning from complaints, and promotion of complaints.
Access, effectiveness, use and responsiveness were all metrics we asked residents to score their landlord on in terms of complaints. Scores were broadly similar to last year (between 2.6 and 3 out of 5).
We believe that the statutory Complaint Handling Code, currently being consulted on, and the Ombudsman's duty to monitor compliance with the Code will help to improve these scores.
Resident results
46% of residents said their landlord promotes the complaints process to them, an improvement on last year (34% no and 20% don't know).
More encouragingly, 63% of residents said their landlord signposts to the Ombudsman, with 26% saying it did not. Once again under our new Duty to Monitor powers we will be able to be more proactive with those landlords who are not doing this.
Other key stats from the resident survey:
- 44% of residents said complaints lead to change - up from 30% last year
- 41% of residents said their landlord shared learning – up from 36% last year
Landlord results
In our landlord survey, we learned that landlords are now reporting that they share learning from complaints monthly, rather than quarterly as previously reported.
88% of landlords said they now signpost to the Housing Ombudsman at the start, during and end of the complaints process – up from 50%, 40% and 85% respectively.
And we are still seeing good results of reflection by landlords after these self-assessments. 67% have changed a policy or procedure due to self-assessment. This figure is broadly the same as last year.
We asked what specific actions landlords have taken to address higher complaint volumes and received:
- Weekly complaints meetings to address complaints
- Monthly assessment of complaints
- Recruitment of staff to meet demand
- Creation of a dedicated team
- Reviewed all aspects of the complaint handling framework
- Increased the FTE in the Complaints Resolution Team