
Annual Complaints Review 2025-26
On this page
Key findings
This year’s Annual Complaints Review looks at cases we determined between 1 April 2025 and 31 March 2026. There are 4 trends that stand out.
- More complaints, fewer upheld: We investigated more complaints but upheld a lower proportion. The number of no maladministration and reasonable redress findings both increased, suggesting our service is easier to access and the Complaint Handling Code is helping landlords resolve issues fairly. Even so, severe maladministration still affected hundreds of households.
- A change to how we investigate: From October 2025, we started examining complaints handling in every case we investigated, not just when it was directly complained about. This affects how this year’s maladministration rates compare with previous years and sets a new benchmark for comparison.
- Repairs remain the biggest concern: Most severe maladministration findings relate to repairs, showing disrepair continues to seriously affect residents’ lives. Landlords must act quickly on repairs and prepare for the extension of Awaab’s Law.
- Performance varies by landlord and region: Though variation within each group is often greater than between groups. Housing associations may have more flexibility to put things right before a complaint reaches us. We saw high rates of complaints in London, suggesting landlords are finding it challenging to provide services and meet resident expectations in the capital.
About this report
The Housing Ombudsman Service is a free, impartial public body that resolves disputes between social housing residents and landlords. At the end of the year 2025-26, we had 1,670 landlords who are members of our Scheme. Together, they represent just over 5 million households who can come to us for help with their housing complaint.
The Annual Complaints Review (ACR) provides a statistical overview of cases we determined between 1 April 2025 and 31 March 2026. This report sets out changes to demand on our service and outcomes for residents. Landlords can use this report alongside individual reports to understand how their performance measures up nationally and to learn about wider trends.
To produce this report, we extract data from our casework management system and use exception reporting to ensure accuracy. We send landlords reports of their complaints outcomes so they can review our dataset against their records. We use data from the Regulator of Social Housing to calculate the number of homes owned and managed by each member.
The ACR complements the individual landlord reports and the landlord data tables. These present the complaints performance of all landlords with more than 5 findings within the year.
Landlords can use the ACR to evaluate themselves against similar providers or the national picture. The ACR also explains how changes at the Housing Ombudsman Service may affect their reported performance statistics.
We use the ACR dataset and findings to assess landlords’ complaints performance, identify emerging sector trends and scope new insight and learning products.
What our decisions mean
When we have investigated a case, we issue a determination. We break the determination down into findings according to the different aspects of a case. The findings we can make are:
- severe maladministration – the most serious failing, where the landlord’s failure caused significant harm to the resident
- maladministration – there was a failing which negatively affected the resident
- service failure – there was a minor failing, but action is still needed to put things right
- reasonable redress – there was a failure, but the landlord put things right before our investigation
- no maladministration – the landlord acted fairly and reasonably
- mediation – the complaint has been resolved with the Ombudsman’s help
If we make a finding of severe maladministration, maladministration, or service failure, we consider the complaint ‘upheld’. This means something went wrong for the resident and the landlord’s processes failed to put it right. This might mean that:
- the landlord did not meet its legal obligations
- the landlord did not follow its policies and processes
- the landlord did not act fairly or reasonably
Overall sector performance
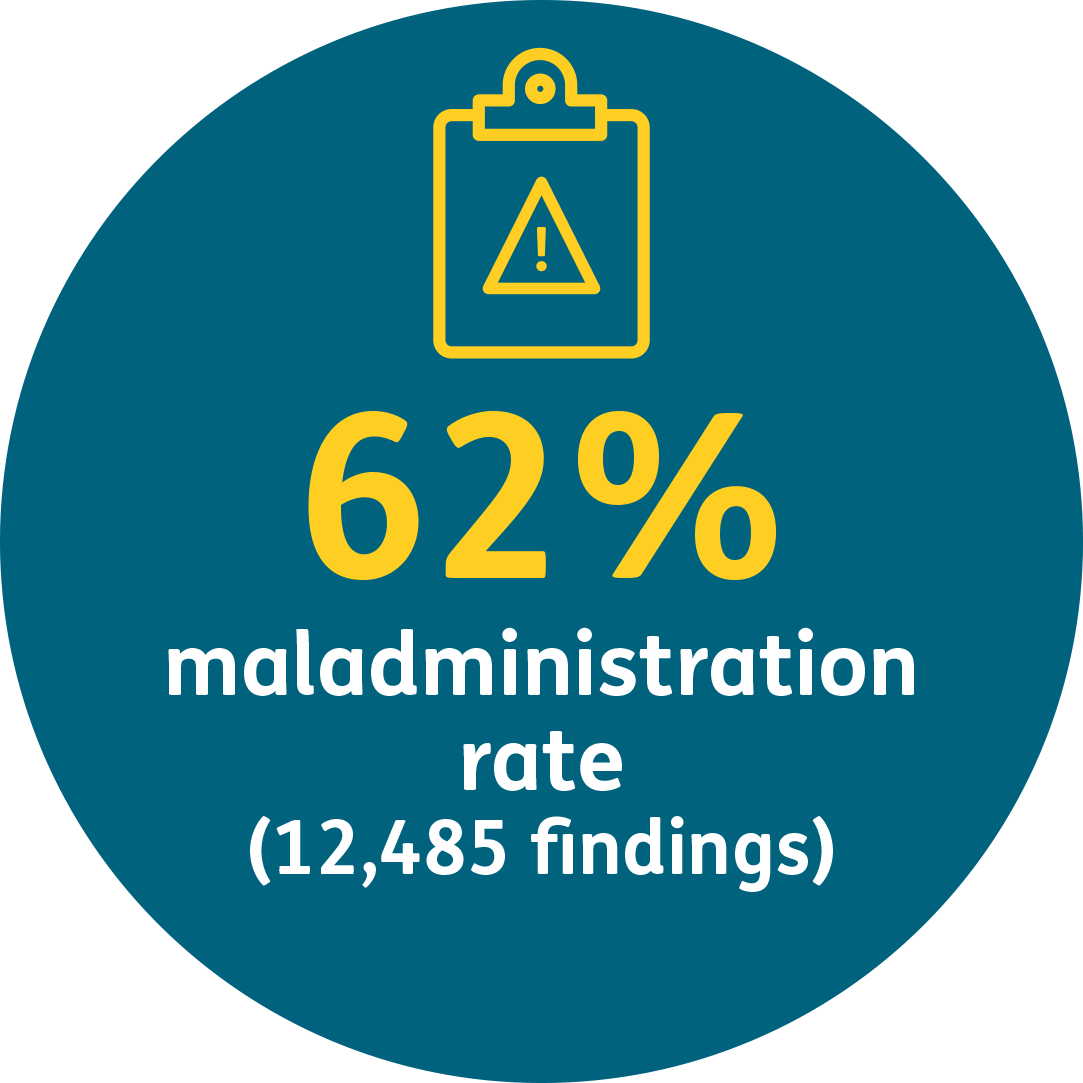
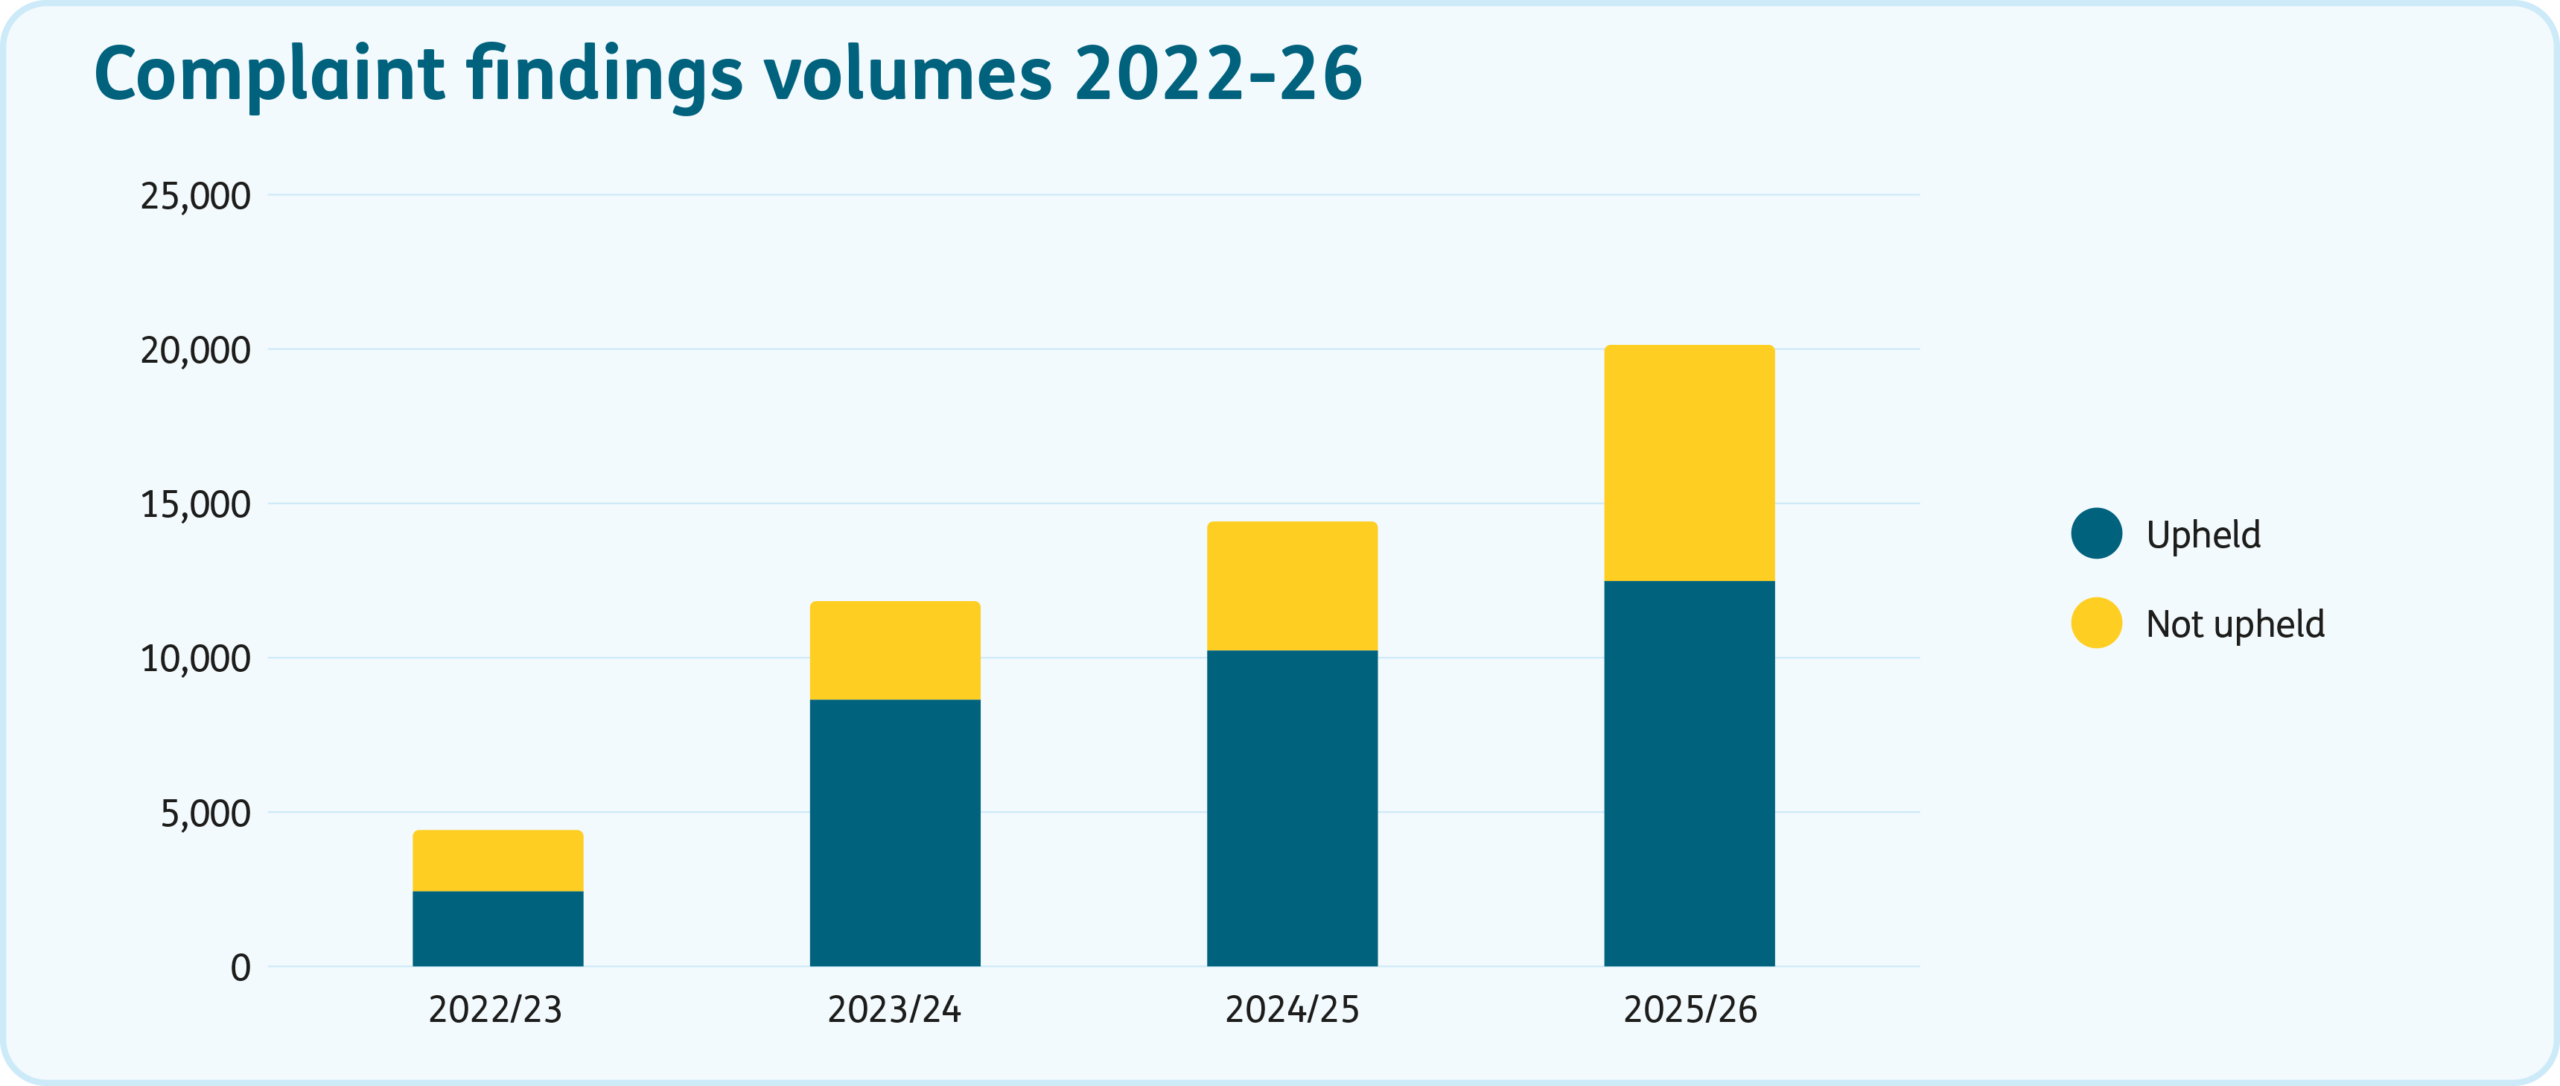
We upheld 62% of complaints in 2025-26, 9 percentage points lower than in 2024-25. The volume of complaints we upheld rose by 22% to 12,485 findings.
The growth in volume is partially driven by changes to our processes, although we determined almost 2,000 more cases in the year. We always investigate the matter the resident complains about but, this year, we started considering the landlord’s handling of the complaint in every case. We record this as a separate complaint with its own finding.
Without complaints handling, the uphold rate would be 65%. This is slightly lower than in 2024-25 (68%). Overall, this is a continuation of the trend we observed in the previous year, where we investigate more complaints but fewer are being upheld.
During the year, we started recording the reason for upholding complaints. Across all complaints, the most common reasons for finding maladministration were:
- failure to apply policies and procedures
- delaying unreasonably in dealing with the matter
- non-compliance with the Complaint Handling Code
Severe maladministration
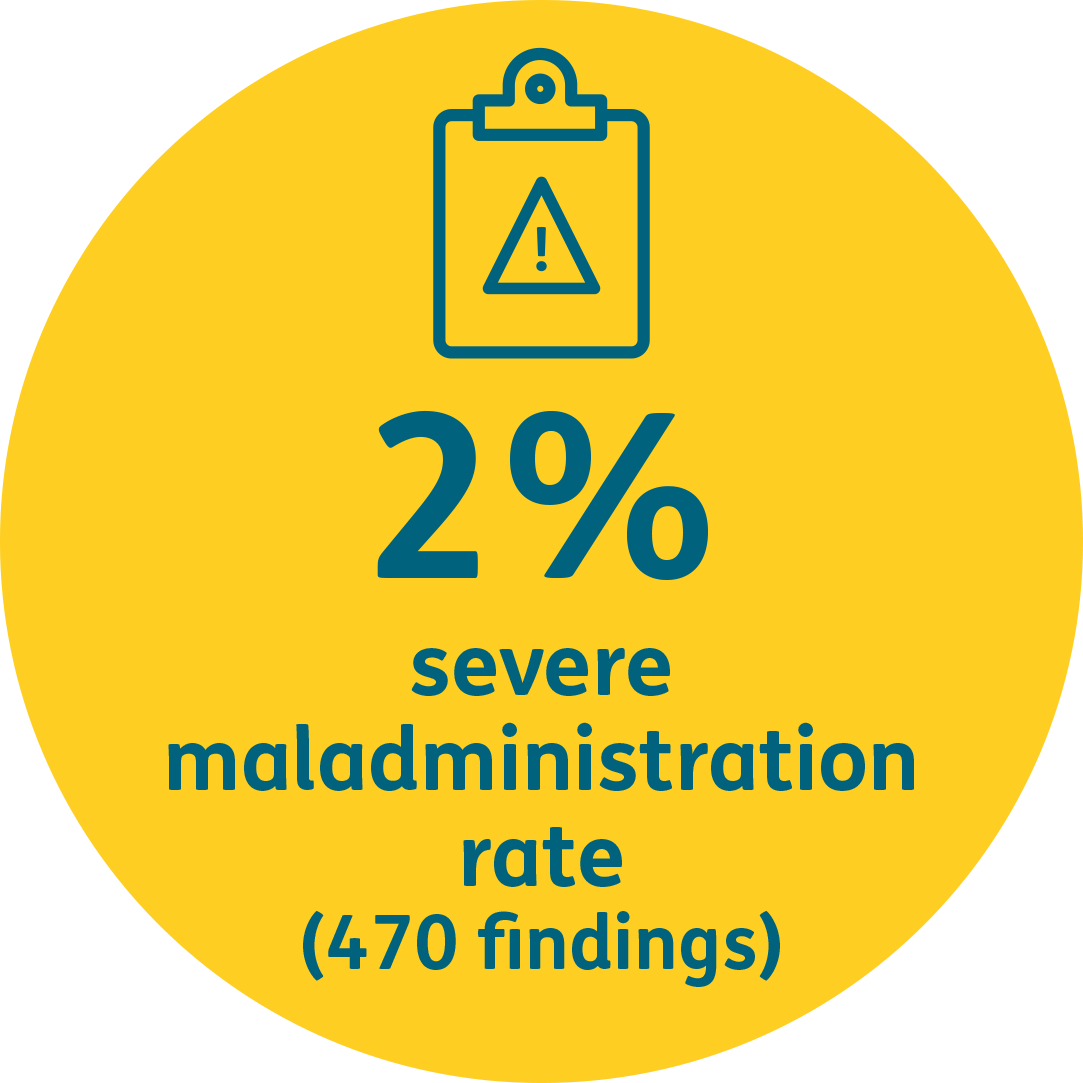
The most serious failings result in a finding of severe maladministration. 2% of all our findings were severe maladministration, totalling 470 findings in 2025-26. This is fewer than the number of severe maladministration findings in 2024-25 (714 findings) and a lower proportion (down from 5%).
Without complaints handling findings, the severe maladministration rate would be 3% (down from 6% without complaints handling in 2024-25).
A finding of severe maladministration means we have determined that the landlord’s actions caused significant harm to the resident. That harm might involve:
- loss of use of part of their home
- damage to their belongings
- long-term distress and inconvenience in resolving the issues
The harm can be made worse by the landlord failing to consider the impact of vulnerabilities such as disability, illness, or household circumstances.
99% of cases with severe maladministration findings resulted in an order for compensation. Accounting for categories of complaint, we found compensation orders for severe maladministration findings were about £1,000 higher than for maladministration or service failure.
We found more severe maladministration in landlords’ handling of complaints about Responsive Repairs than any other category (355 findings; 75% of all severe maladministration findings). We saw a greater proportion of severe maladministration findings coming from local authorities than for housing associations (3% versus 2%). Complaints from homes in London had the highest rate of severe maladministration of any region at 3%. London was followed by East of England and the South East at 2%.
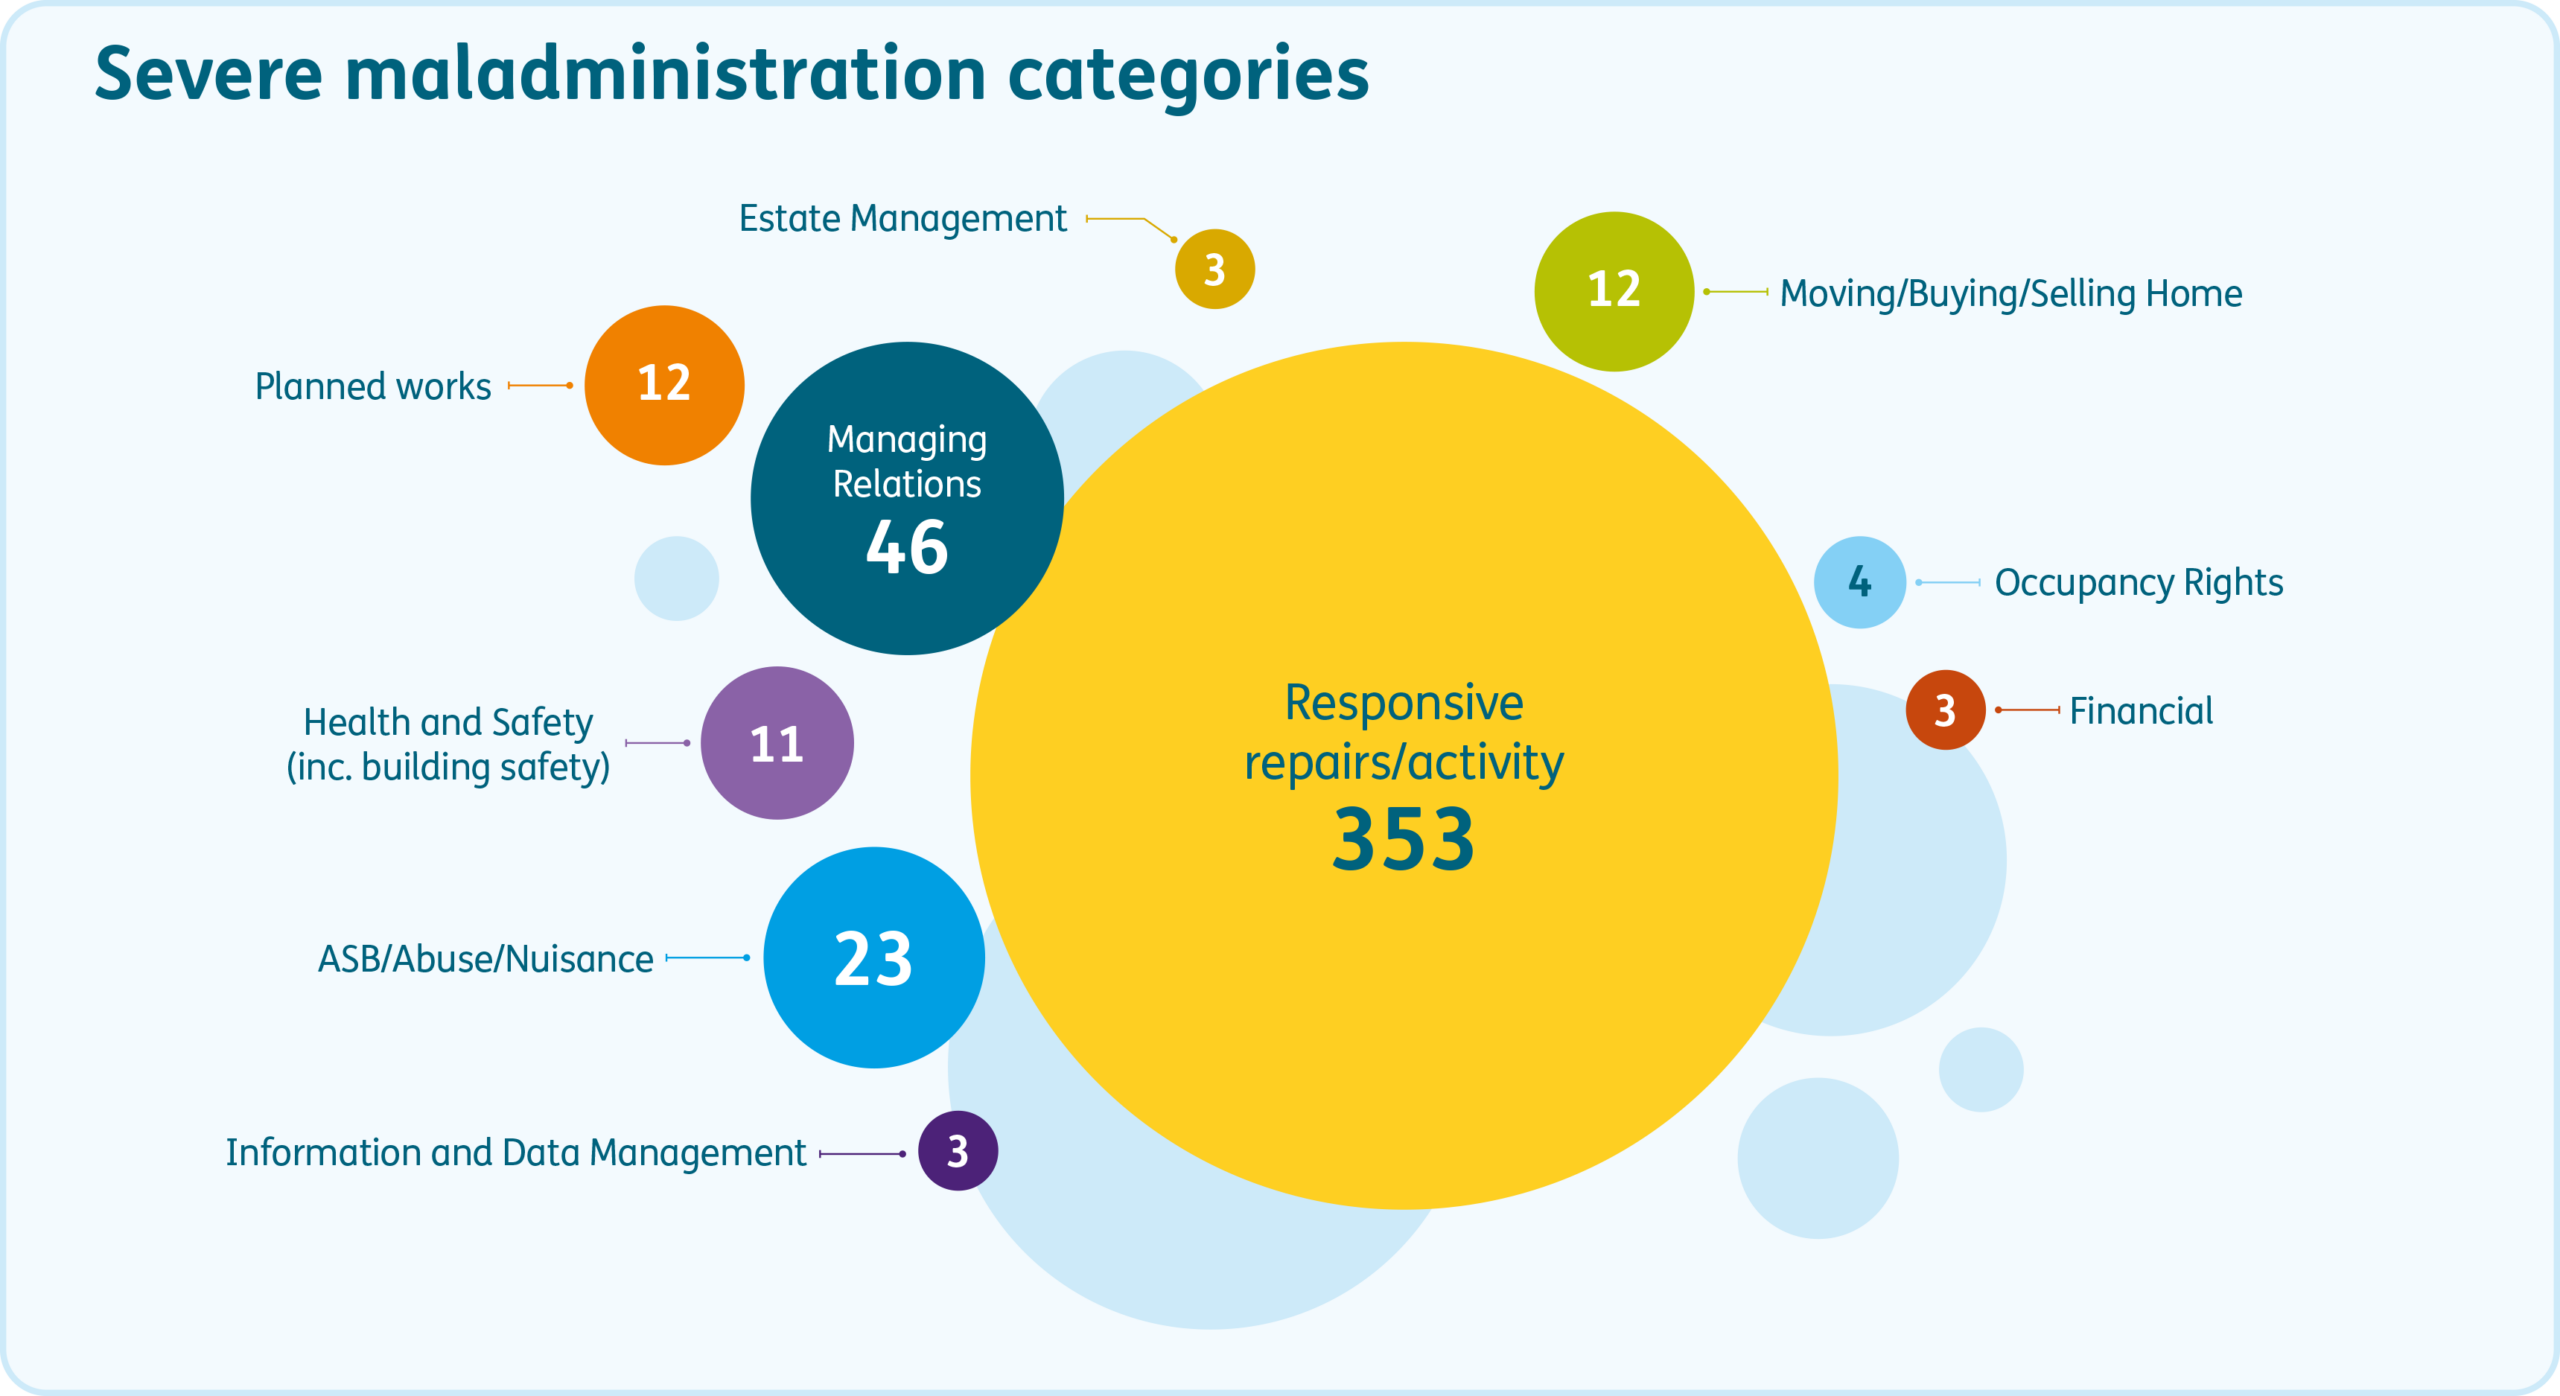
Our report on learning from severe maladministration highlights cross-cutting failures in repairs cases that resulted in severe maladministration:
- lack of a person-centred approach
- poor communication
- inadequate record keeping and knowledge management
- risk assessments not undertaken
- failure to consider temporary solutions while waiting for major works
These reports include learning statements from the landlords whose cases feature in them. Effective learning statements acknowledge the root causes of failure and make specific commitments to put things right for residents.
The decrease in the number and proportion of severe maladministration findings shows an improvement. However, this figure still represents things going severely wrong for hundreds of households. Each finding is an opportunity for landlords to learn and put things right in processes that failed.
Landlord type, size, and region
Landlord type
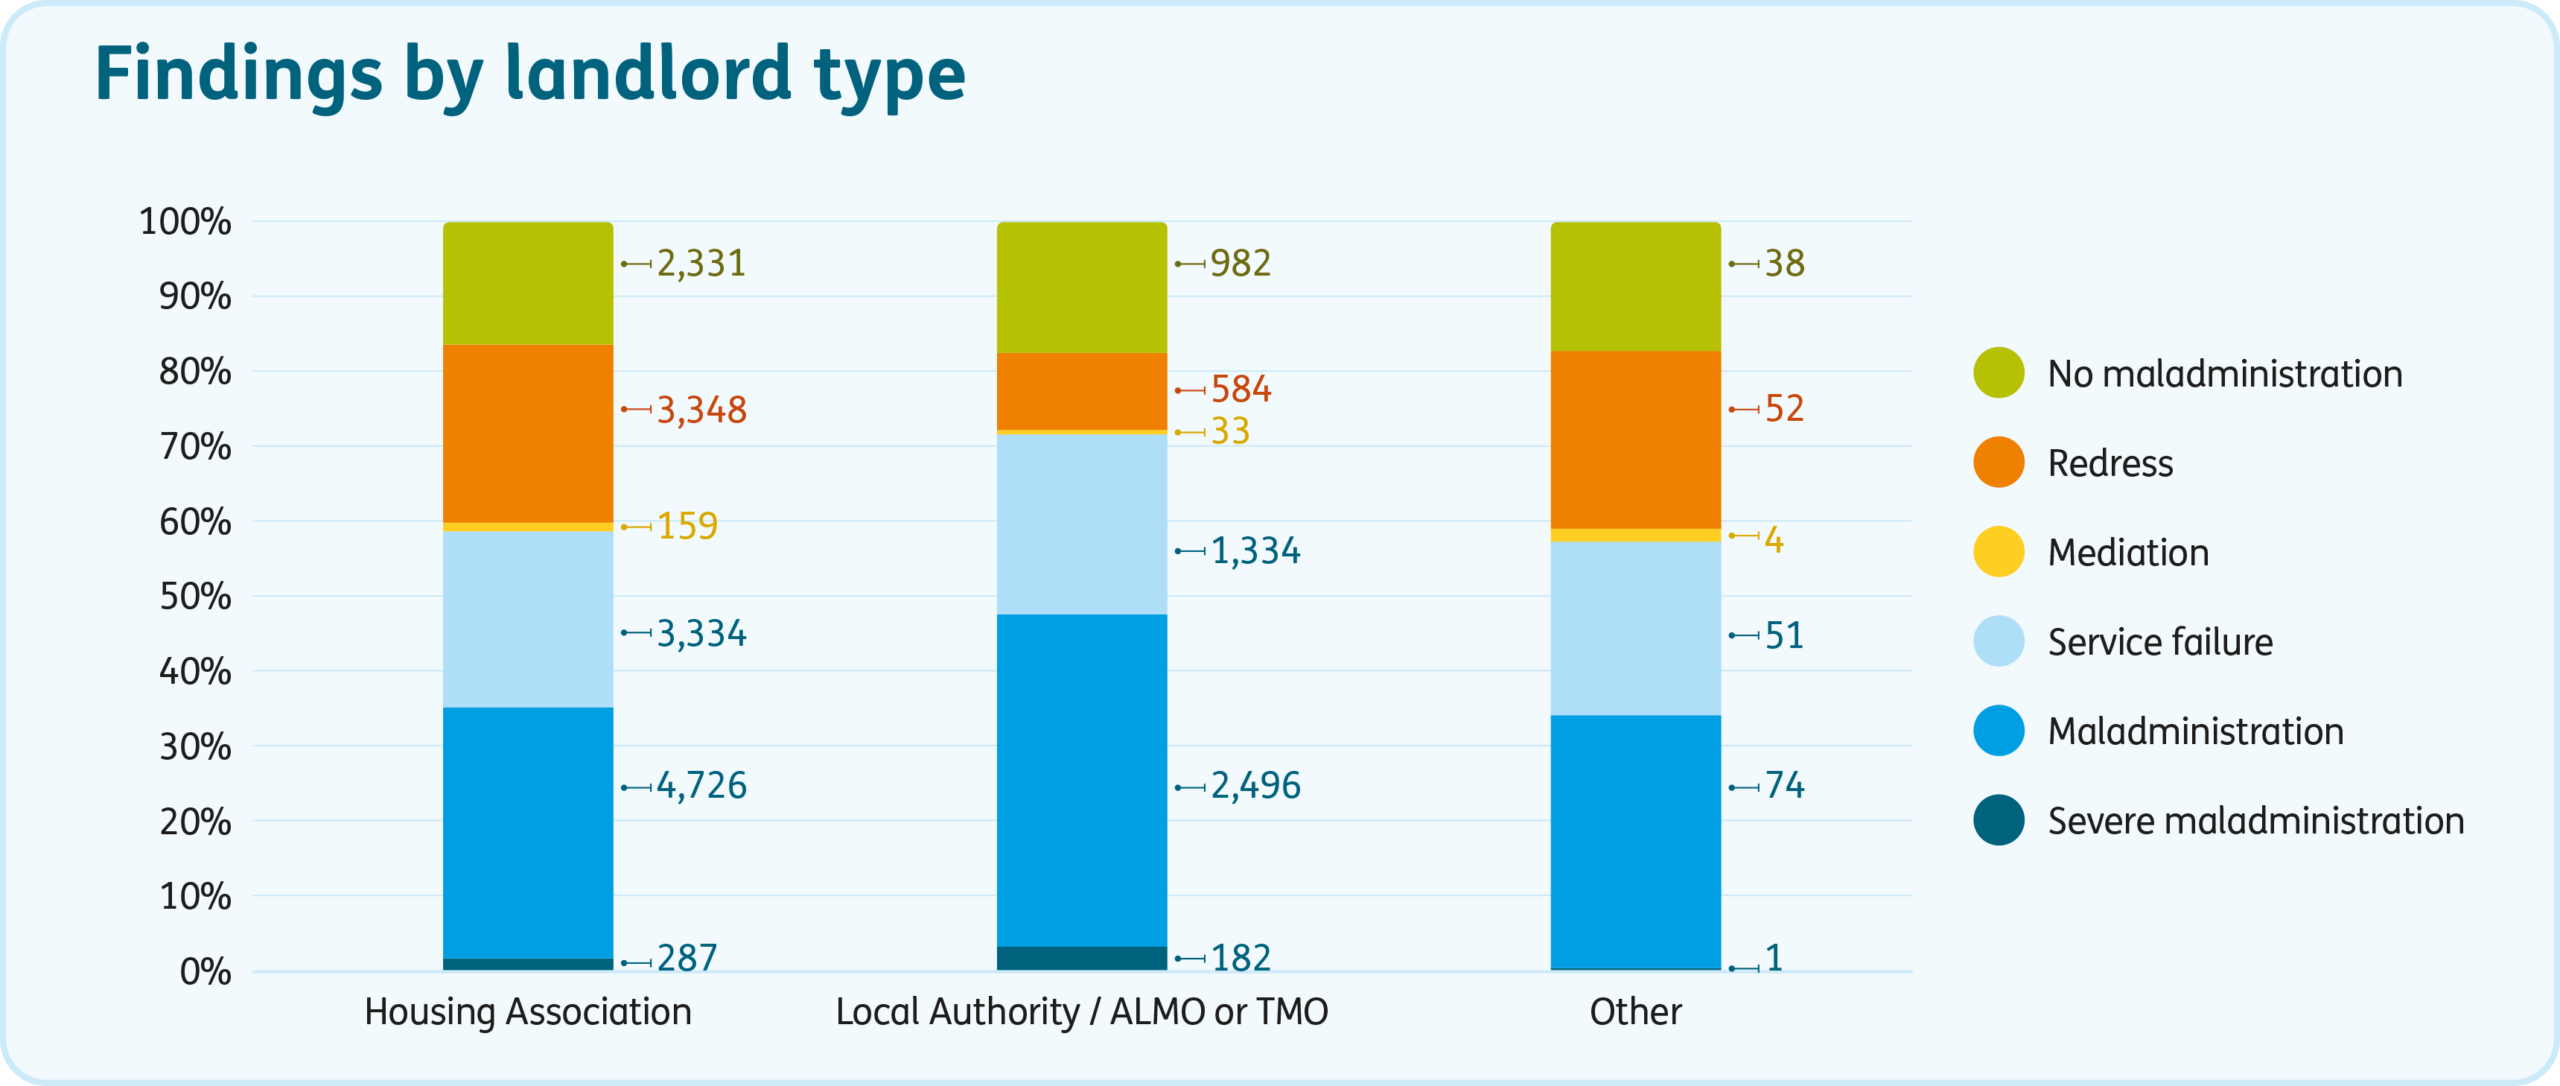
There were differences in the number and rate of upheld findings between types of landlord. As we found in 2024-25, we upheld about 13 percentage points more complaints about local authorities than about housing associations (72% vs 59%). While the gap has remained constant, the uphold rates for both types of landlords have reduced.
Local authority landlords include Arm’s Length Management Organisations and Tenant Management Organisations. The difference in uphold rate is accounted for by the difference in the rate of reasonable redress findings. Housing associations offered reasonable redress at a rate of over twice that of local authority landlords (24% vs 10%). Taken together, this suggests that:
- things are going wrong for residents of both types of landlord at similar rates
- housing associations may be putting things right more frequently before complaints reach us
‘Other’ landlords include almshouses, co-operatives and for-profit providers. They generate a smaller proportion of the complaints we investigate. There has been a recent increase in the number of social homes owned and managed by for-profit providers. However, the number of these landlords is still too small to draw strong conclusions about the quality of services or complaints handling they provide.
We saw differences in the kinds of complaints we received from residents with different tenures. We saw many more complaints about Financial matters from leaseholders and shared owners (11% and 16% of all complaints versus 3% for rental tenures). We also investigated more complaints about Estate Management from these tenures (7% and 6% versus 3% of rental tenures). Complaints about Moving/Buying/Selling Homes made up a much larger part of shared owners’ complaints (10% of all complaints vs under 5% for rental tenures). Rental tenures had a greater proportion of complaints about ASB/Abuse/Nuisance compared to ownership tenures (8% versus 4%). The differences here are likely to be related to the different obligations and expectations for each type of tenure.
We upheld 67% of leaseholders’ complaints and 57% of shared owners’ complaints, compared with the overall rate of 62%. This is linked to the type of complaints we receive from residents. We are less likely to uphold complaints about Financial matters and Moving/Buying/Selling Homes. Dissatisfaction in these categories is often connected to the contractual aspects of the matter rather than the landlord’s handling of the issue.
Landlord size
We saw some variation in outcomes across landlord size bands. We saw more findings of redress for medium to large landlords (10-49,000 homes and over 50,000 homes). This may reflect larger landlords’ greater flexibility to offer compensation following failings. This was true for both local authorities and housing associations.
We saw higher rates of no maladministration findings for smaller landlords. The highest rates of no maladministration findings were for landlords with under 1,000 units. This is skewed by small numbers of cases and low rates of redress for small landlords.
Landlord size did not appear to make much difference to performance once landlords had more than 1,000 homes. Average maladministration rates were similar across all size bands, at 62% to 63%. We also saw similar rates of upheld complaints per 1,000 homes between size bands. The biggest differences in performance statistics were between landlords in the same size band. This suggests that how landlords work has more impact on residents than how large they are.
Region
We investigated more complaints and upheld more of them in London than any other region. We compared complaints performance for landlords with homes both inside and outside London. We found that there were twice as many complaints per 1,000 homes inside London, but the rate of upheld complaints was similar for both groups of homes. This suggests that there are challenges inside London that have impact on landlords’ ability to consistently provide services and handle complaints. London’s ageing stock and higher rates of overcrowding are likely to be playing a part in higher volumes of complaints. We are planning to undertake further exploration of regional differences to inform how we assess landlords’ performance fairly.
Explore other complaint outcomes in more detail
-
No maladministration and reasonable redress
Where the landlord has followed their obligations and policies and acted fairly, our investigation will find no maladministration.
The categories of complaints where we saw the highest rates of no maladministration findings were:
-
- Moving/Buying/Selling Homes (33% of 905 complaints) – complaints about the condition of homes upon letting, transfer applications, and moving home due to circumstances such as disrepair or antisocial behaviour
- Occupancy Rights (39% of 114 complaints) – complaints about the terms of a tenancy or lease, assignment, succession, and ending tenancies
The category with the lowest rate of no maladministration was Responsive Repairs at only 10% of complaints.
There are occasions where our investigation may find some maladministration, but the landlord put things right using its complaints procedure. In these cases, we say there has been ‘reasonable redress’.
In 2025-26 we saw an increase in the proportion of reasonable redress findings (20%, up from 13% in 2024-25). This is a sustained increase over 3 years, and it is encouraging to see it continue. This suggests landlords are getting better at recovering service failings, even if services still need improvement to avoid complaints arising. 66% of reasonable redress findings followed an offer of compensation made by the landlord that we deemed adequate.
Complaints in the Managing Relations category had the highest rate of reasonable redress findings (26%). This reflects a change in our process (see section on categories below). Planned Works (20%) and Occupancy Rights (20%) had the next highest rates of reasonable redress.
ASB/Abuse/Nusiance and Information and Data Management complaints had the lowest rates of reasonable redress findings (both 12%). This suggests landlords could do more to consider the impact the failure in these areas has on residents.
A finding of reasonable redress does not always mean a landlord offered compensation – other remedies can also be effective. 22% of reasonable redress findings involved case-specific actions such as providing better explanations for decisions or helping residents to access other services. We encourage landlords to consider where non-monetary solutions may be appropriate when handling complaints.
We will continue to publicise findings of no maladministration and reasonable redress on social media, in our Spotlight reports, Insight reports, and through our Centre for Learning. By doing so, we hope to provide landlords with learning that will support them in early and effective complaints resolution.
-
-
Maladministration per 1,000 homes
The maladministration findings per 1,000 homes metric is a size-adjusted measure of maladministration, allowing for fairer comparisons between landlords. We use this metric alongside the maladministration rate to capture landlord performance relative to size.
The median number of maladministration findings per 1,000 homes was 1.6 in 2025-26. Breaking this down by landlord type shows median rates were slightly higher for housing associations (1.6) compared to local authorities (1.3).
Maladministration per 1,000 homes also varies across landlord size. Large housing associations also had a high median rate (3.5). Small to medium-sized landlords tend to have the lowest numbers, possibly benefiting from established systems without the same level of scale or complexity.
-
Regulatory standards and upheld complaints
The Regulator of Social Housing (the Regulator) inspects landlords to assess how they are meeting the outcomes of the regulatory standards. It is about halfway through its 4-year cycle of grading all landlords with over 1,000 homes so the statistics here should be treated with caution.
The consumer standards concentrate on the provision of housing services, including complaints. Landlords receive a score from C1 (meeting standards) to C4 (serious failings). We looked at how the Regulator’s Consumer Standards regulatory notices aligned with our performance figures for landlords receiving an individual report in 2025-26.
In 2025-26, landlords with a C1 or C2 grading tended to have lower uphold rates than landlords with C3 or C4 grades. The average uphold rates were 59% for C1 and C2 and 68% for C3 and C4. The difference in uphold rates seems to be partially driven by differences in operations between local authority landlords and housing associations. Almost half of local authority landlords with consumer gradings have been given C3 or C4 (44%), compared with only 5% of housing associations. Since local authorities tend to have higher uphold rates, the average uphold rate for C3 or C4 landlords appears higher.
We also compared median upheld rates for C1/C2 landlords against C3/C4 landlords, broken down by type. Local authorities had similar rates in both groups, at around 2 upheld findings per 1,000 homes. However, housing associations with C3 grades had a median rate of 3.5, 1.5 findings per 1,000 homes more than those with C1 or C2 grades.
Categories
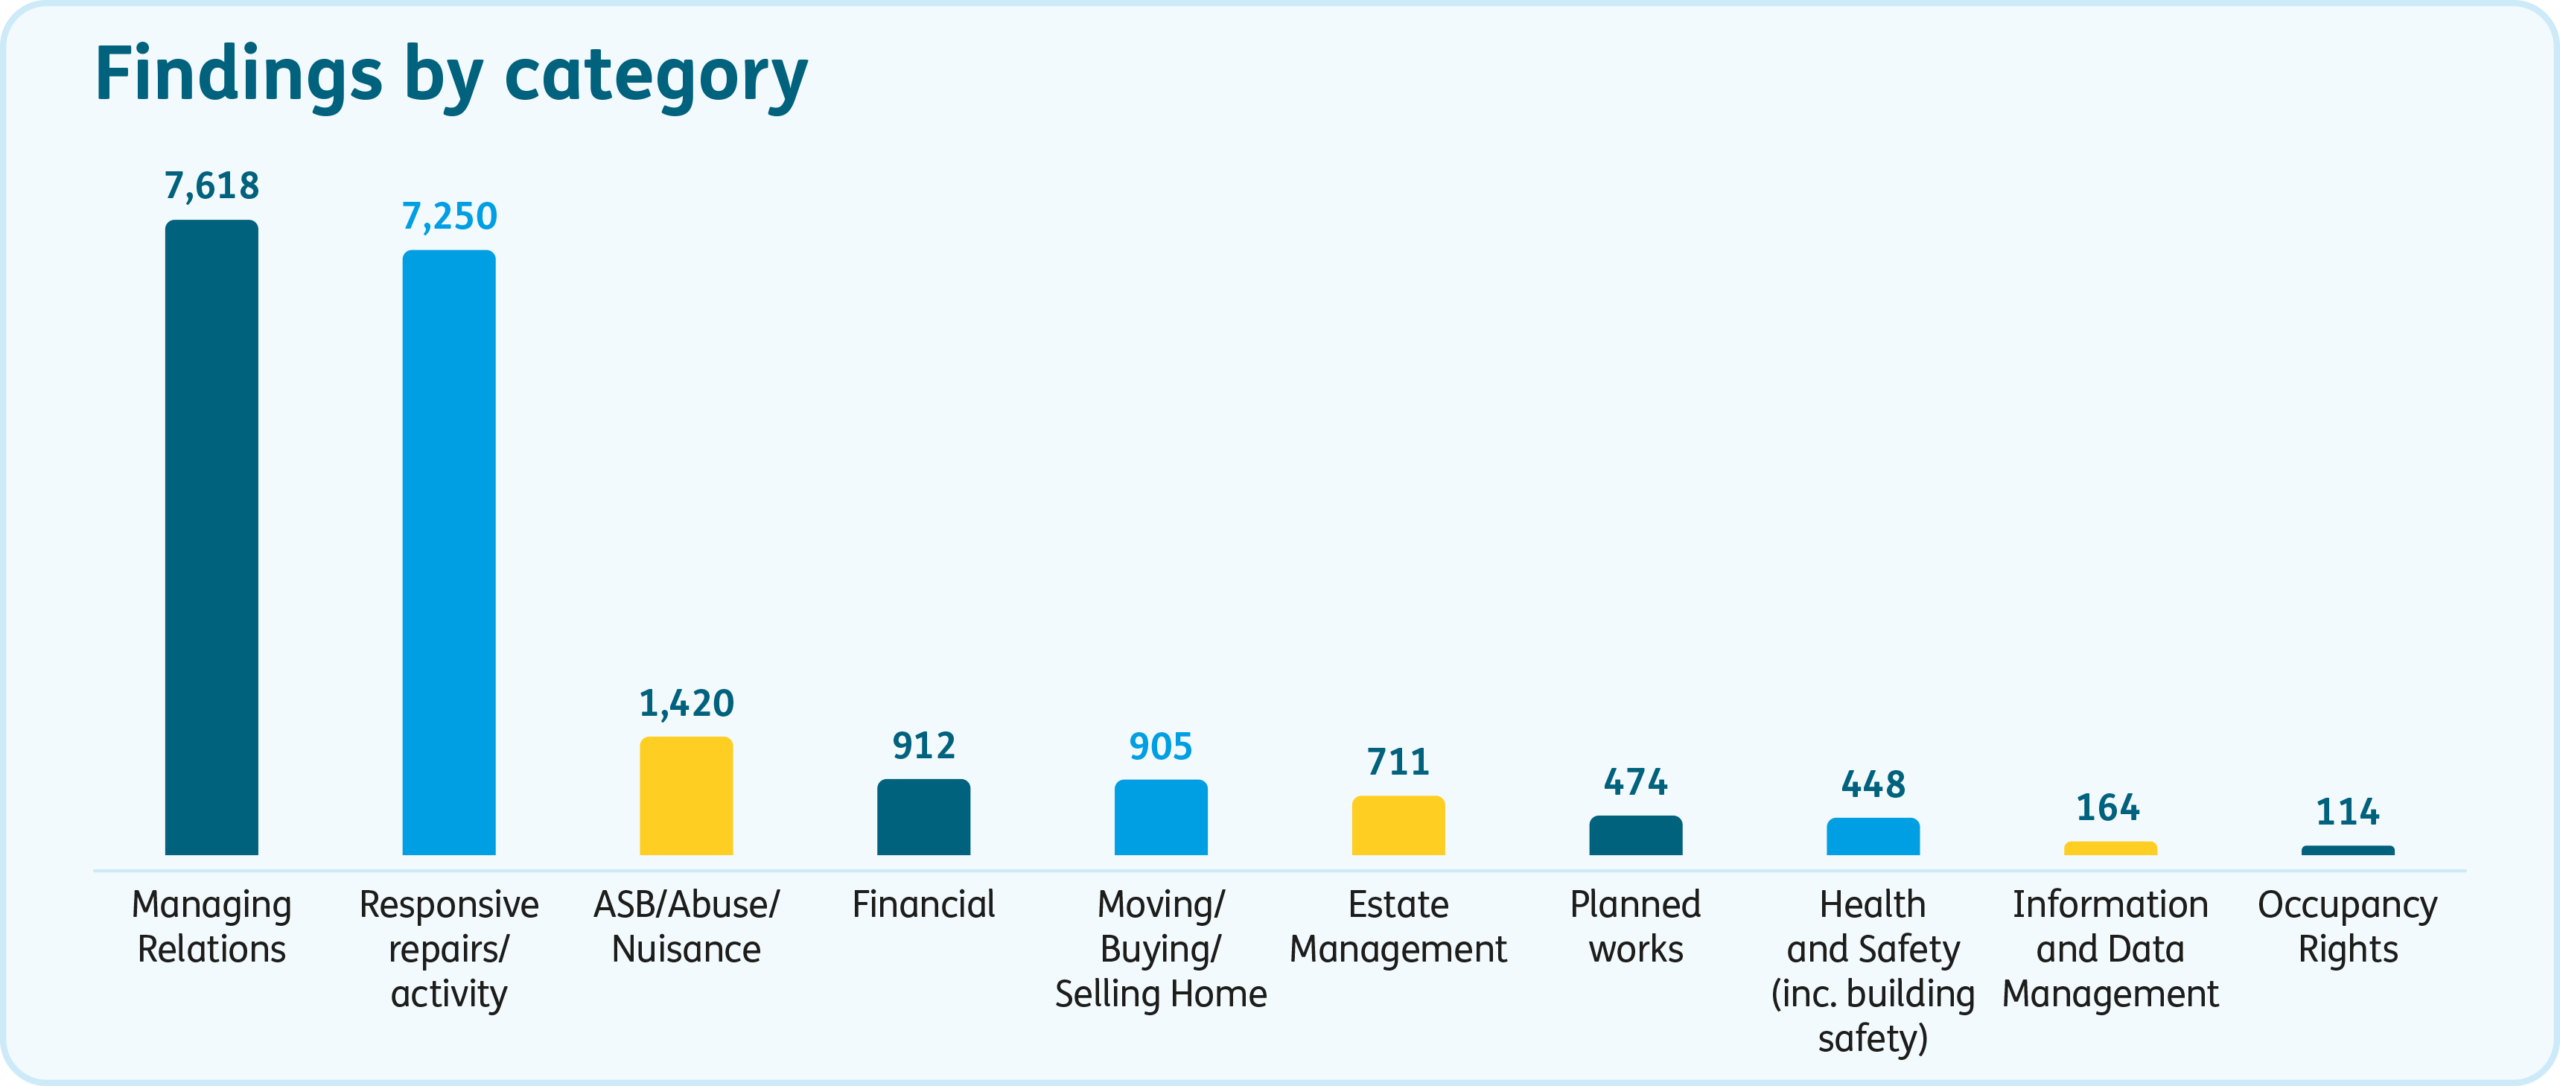
Every case we investigate is made up of at least one complaint, which we record under its category. When we decide a complaint, we make a finding. We made 20,016 category findings in 2025-26, up from 14,420 in 2024-25.
This excludes complaints which were either deemed outside of our remit (‘outside jurisdiction’) or withdrawn by the resident before we investigated.
Changes to our investigations
At the beginning of 2025-26, we changed the way we categorise complaints. We reorganised our category headings and introduced new categories for complaints about antisocial behaviour (ASB), health and safety issues, and planned works. This allows us to analyse our casework in greater detail than before and aligned us more closely with how our members categorise complaints.
We also started looking at complaints handling in all cases. The section below goes into more detail on this point.
Explore categories in more detail
-
Responsive Repairs
Responsive Repairs was the biggest category after complaints handling and represents the greatest number of upheld findings. 80% of cases determined in 2025-26 contained a finding about Responsive Repairs. We upheld 72% of all findings about repairs, a very slightly lower rate than the previous year (73%). The rate of severe maladministration findings in Responsive Repairs has reduced to 5% from 8%.
Behind every repair is a resident who wants to receive a high quality, prompt repairs service. When the most serious failings occur, residents often experience excessive delays, poor communication or a failure to recognise and adapt to their circumstances.
The Hazards in Social Housing (Prescribed Requirements) (England) Regulations 2025, also known as Awaab’s Law, came into force on 27 October 2025. Social landlords now have to address emergency hazards and damp and mould cases that present a significant risk of harm to tenants within fixed timeframes.
Awaab’s Law cases have begun to come through to the Ombudsman for investigation. We are monitoring these cases and aim to publish insights when we have investigated enough cases.
Our Spotlight report on repairs and maintenance contains further learning and guidance. The reports support landlords to reduce the number of complaints about repairs that they receive locally and to avoid escalation to us.
Condensation, damp and mould, and leaks
34% of the repairs complaints we investigated in 2025-26 were about condensation, damp and mould. 23% were about leaks. We upheld over 75% of these complaints.
Besides windows, these 2 categories feature the highest severe maladministration rate at 8% and 7% respectively.
Our Centre for Learning includes resources to help landlords improve their handling of complaints about leaks, damp and mould. The centre also hosts multimedia resources on Awaab’s Law.
Windows
We made 283 findings in complaints about Windows, one of the new categories added at the start of the year. This is a relatively small number in comparison to other categories but has the highest uphold rate amongst repairs complaints. We upheld 80% of Windows complaints and found severe maladministration in 10% of them.
Our May 2026 report on learning from severe maladministration focused on complaints about windows. The report identifies 3 recurring themes:
- failure to consider household circumstances, especially the presence of children, disabilities, and other vulnerabilities
- repairs being deferred due to upcoming major works programmes, often without adequate assessment of the risk to living with window disrepair
- poor management of Responsive Repairs leading to delays
-
Managing Relations: complaints handling
As stated above, in 2025-26 we made some changes to how we investigate complaints handling. We moved the category ‘complaints handling’ to sit under the heading ‘managing relations’, reflecting how residents interact with their landlord. This change allows us to consider complaints handling in the round, looking at timeliness, communication, and quality of investigation.
We started to look at landlords’ complaints handling in all cases. Before this, we only investigated complaints handling when asked to by the resident or if we saw evidence of complaints handling failure during the investigation. Looking at complaints handling on all cases allows us to see where complaints handling was reasonable and fair and acknowledge good practice. This can support deeper insight for our systemic and developmental activities and for landlords’ learning.
This change has contributed to a decrease in the uphold rate for Managing Relations. We upheld 57% of complaints in this category and only 0.6% had a finding of severe maladministration. Landlords may notice that their overall maladministration rate is lower than last year: the change in our process will likely have contributed to that.
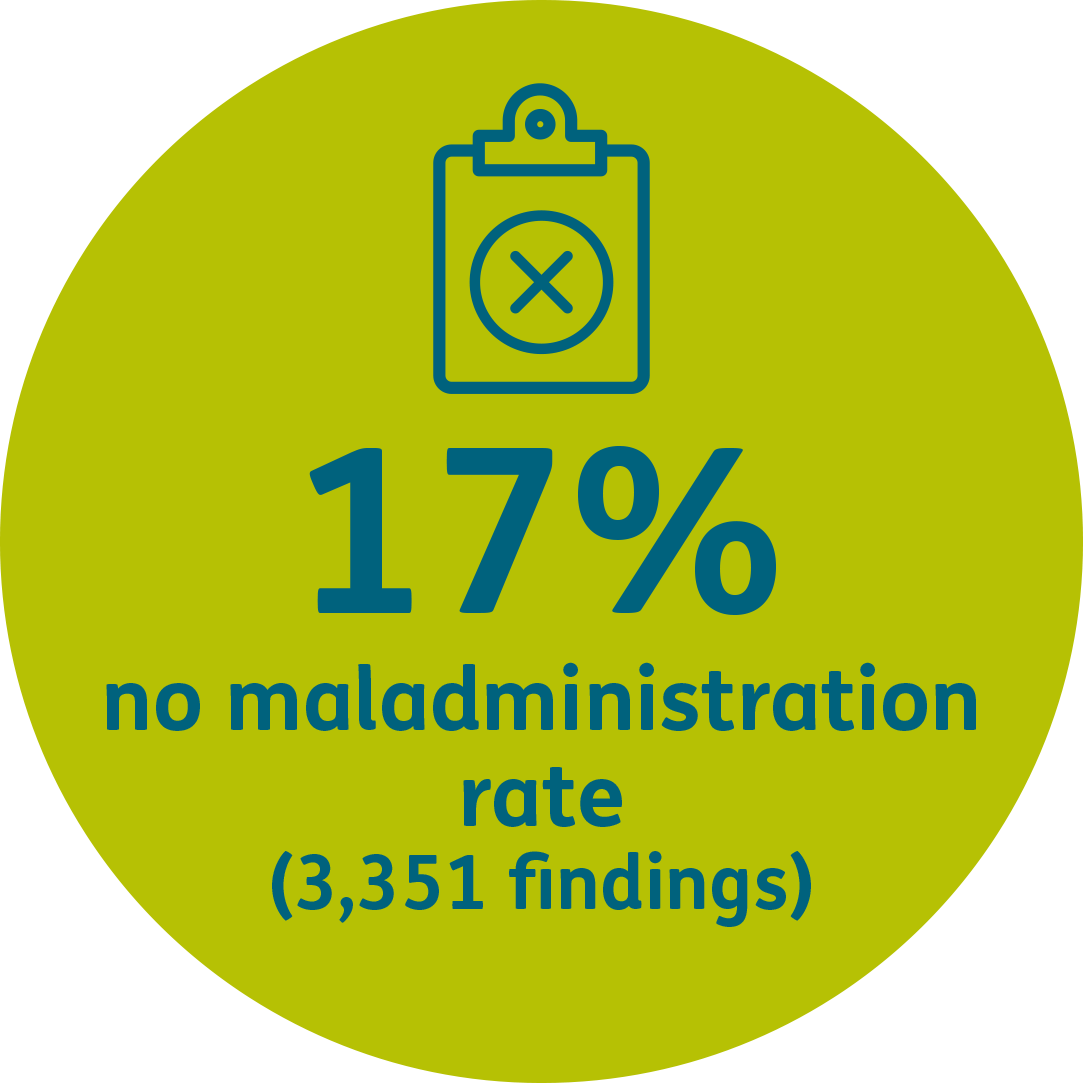
No maladministration findings give landlords the chance to see where complaints handling has gone well. We found ‘no maladministration’ in 17% of complaints about complaints handling. Where we found no maladministration, landlords responded to complaints within timescales, addressed the substantive issues and were effective in communicating progress and decisions.
We saw a higher rate of upheld complaints about complaints handling for local authority landlords than for housing associations. The difference is mostly accounted for by a higher rate of redress for housing associations (31% versus 12%). Again, this suggests resident dissatisfaction with services is arising at similar rates, but there are different organisational responses through internal complaints processes.
On this basis, we encourage local authority landlords to consider where complaints can be satisfactorily resolved through redress. We also encourage housing associations to identify where redress is being repeatedly offered and consider what actions might help to reduce repeated complaints arising.
-
ASB/Abuse/Nusiance
ASB/Abuse/Nusiance complaints make up about 7% of the findings we made in 2025-26. This is the same proportion as the previous year. The uphold rate for ASB cases was higher for local authority landlords than for housing associations (72%; 63%).
About half of all ASB complaints were recorded under the category ‘ASB multiple’. That means that more than one type of ASB issue was present in the complaint. Noise and neighbour disputes were the 2 next biggest categories. This is a reminder for landlords that ASB cases can often be complex, long-term, and can relate to multiple co-occurring issues.
Our learning from severe maladministration report on ASB highlights some key areas landlords could address:
-
- risk assessments that take vulnerabilities and changing circumstances into account
- lack of clear action plans
- engagement with partner agencies
- lack of support and signposting, especially in cases of reported hate crime
Our member landlords frequently ask us for our insights on ASB. This is unsurprising given the challenges in delivering an effective service in this area. We’ll continue to review our cases and share insights with our members through our thematic work and the Centre for Learning.
-
-
Artificial Intelligence
One of the new categories we added in 2025-26 was Artificial Intelligence (AI), under the heading Information and Data Management. Our category guidance says complaints about this may include:
-
- the use of AI to make decisions or provide a service to residents
- AI tools used by staff visiting homes
- chat bots on landlord websites or apps
- misinterpreting tenant contact
- accuracy of the property or personal data used by AI to make decisions affecting residents
- biased decision-making based on data
- lack of human interaction
As use of AI increases for both landlords and residents, we anticipate more complaints in this category. We encourage landlords to prepare for this by training staff on appropriate use of AI and the associated risks.
-
Remedies
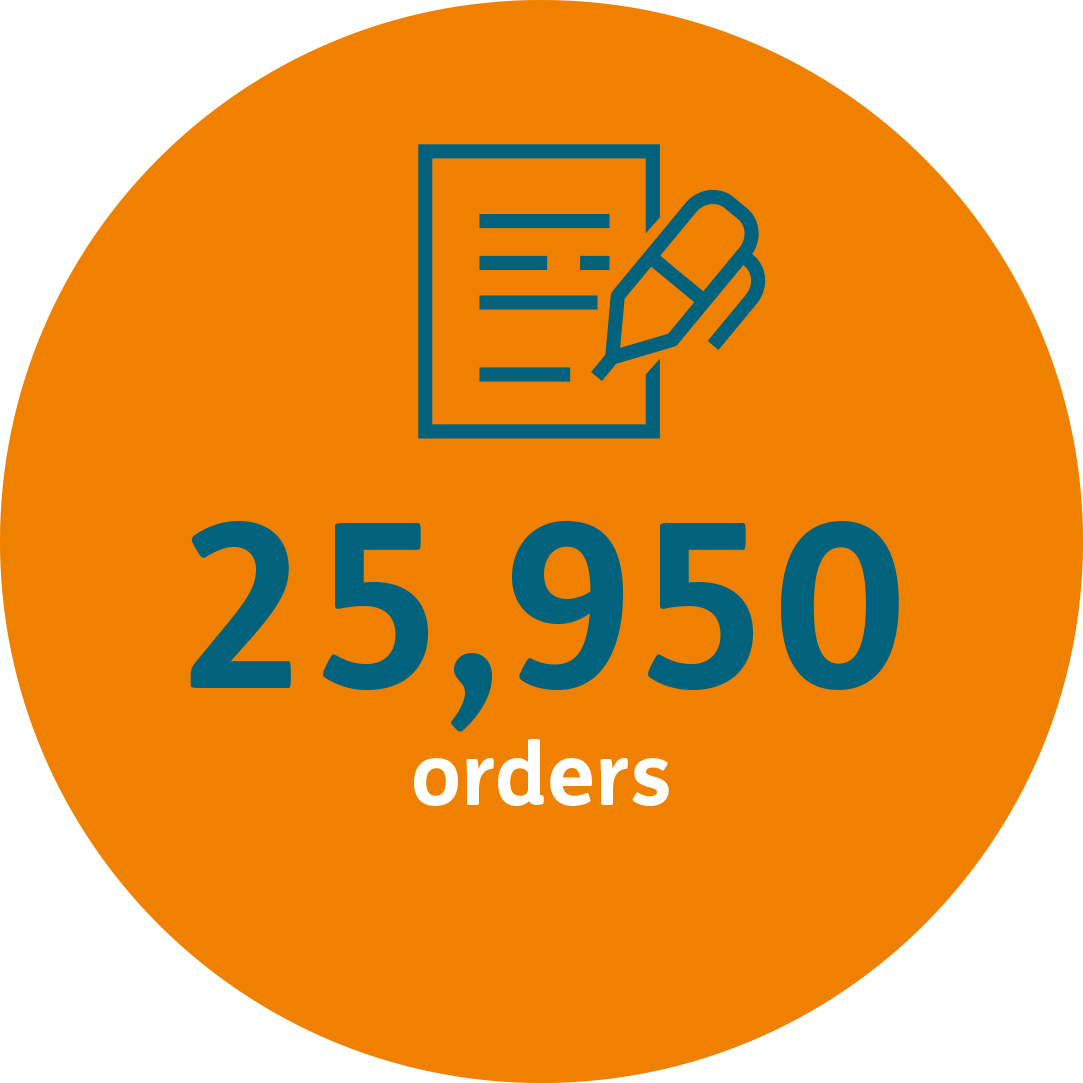
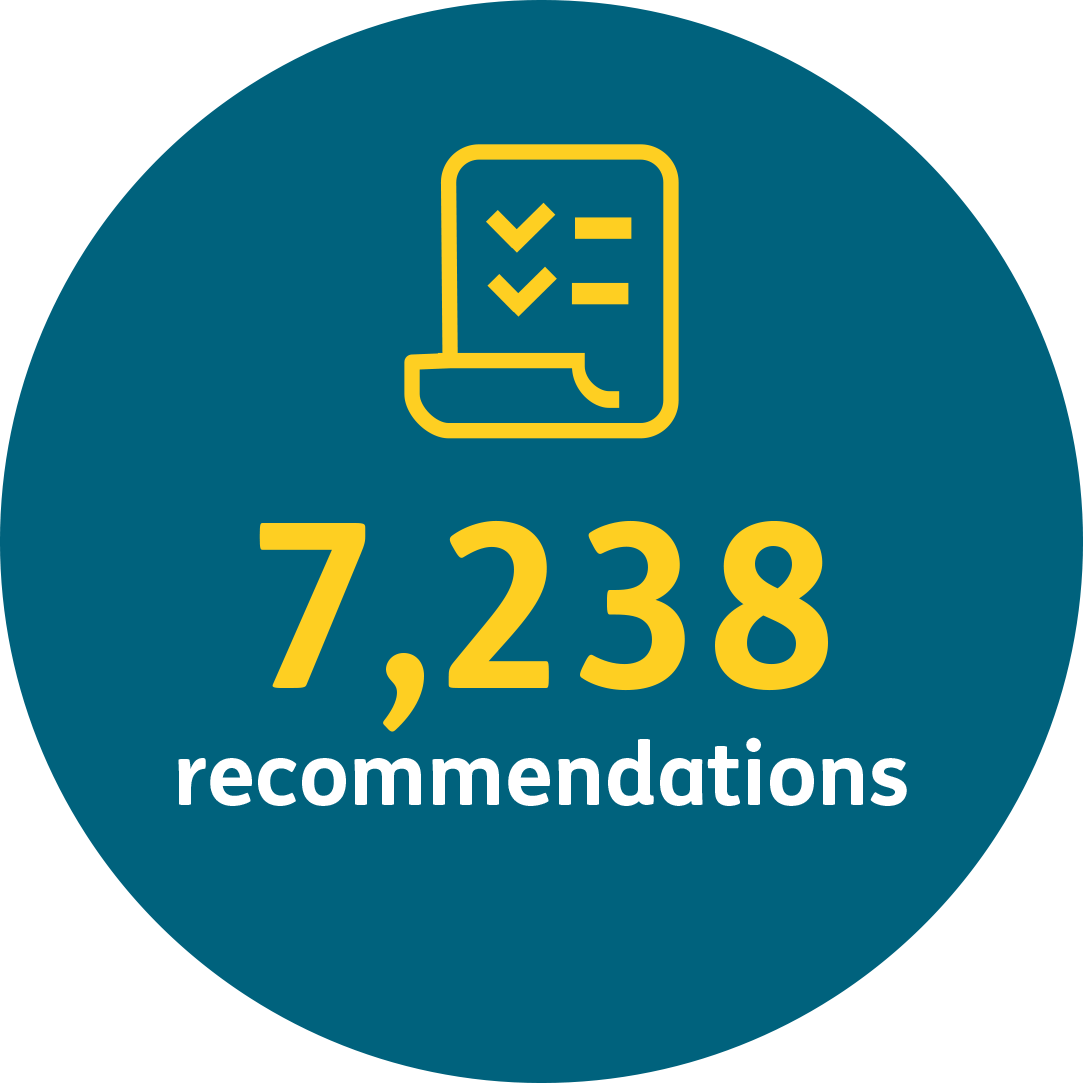
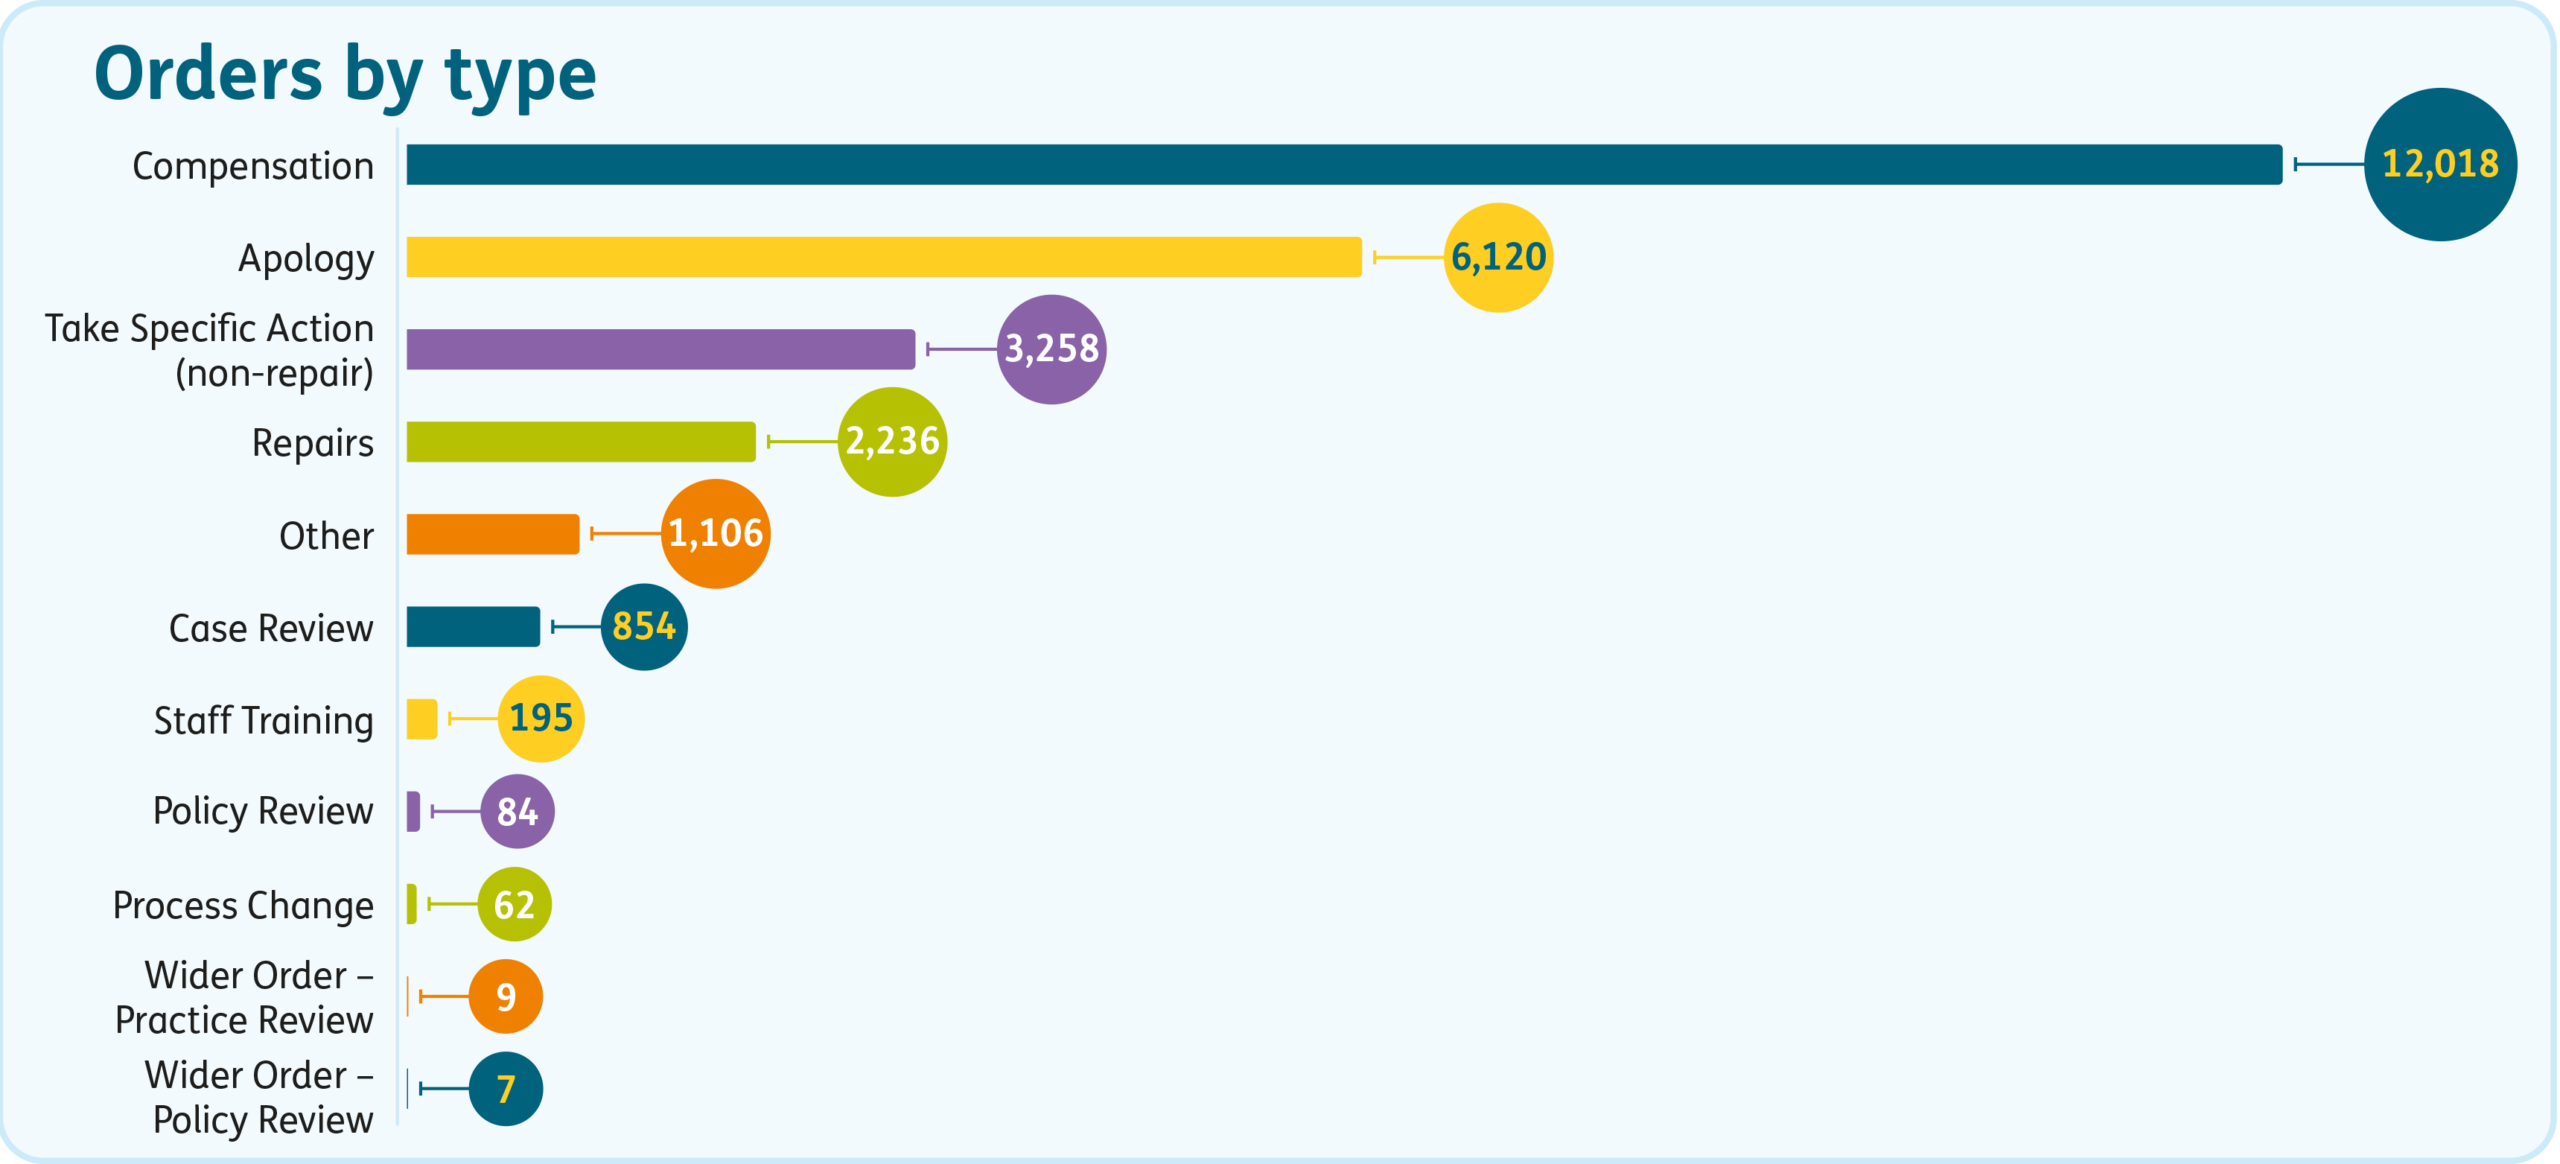
We made 33,189 remedies to put things right for residents, ranging from carrying out repairs to paying compensation and improving practices. This is a 23% increase on the previous year, broadly in line with the increase in findings we made.
Explore orders in more detail
-
Compensation
Compensation was the most common order we made following a finding.
Compensation is intended to be restorative. The amount offered should restore the resident to the position they would be in had the service failure not occurred.
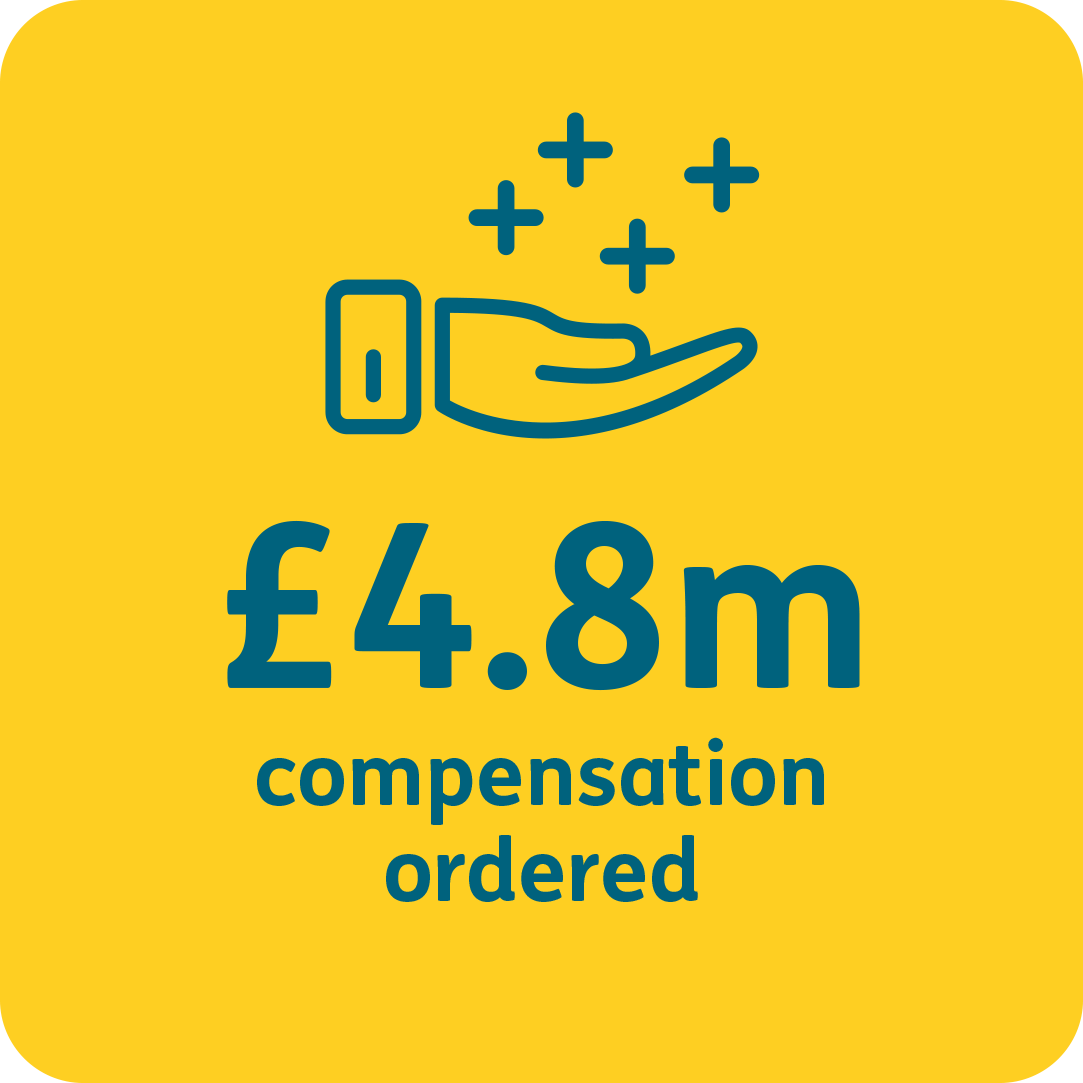
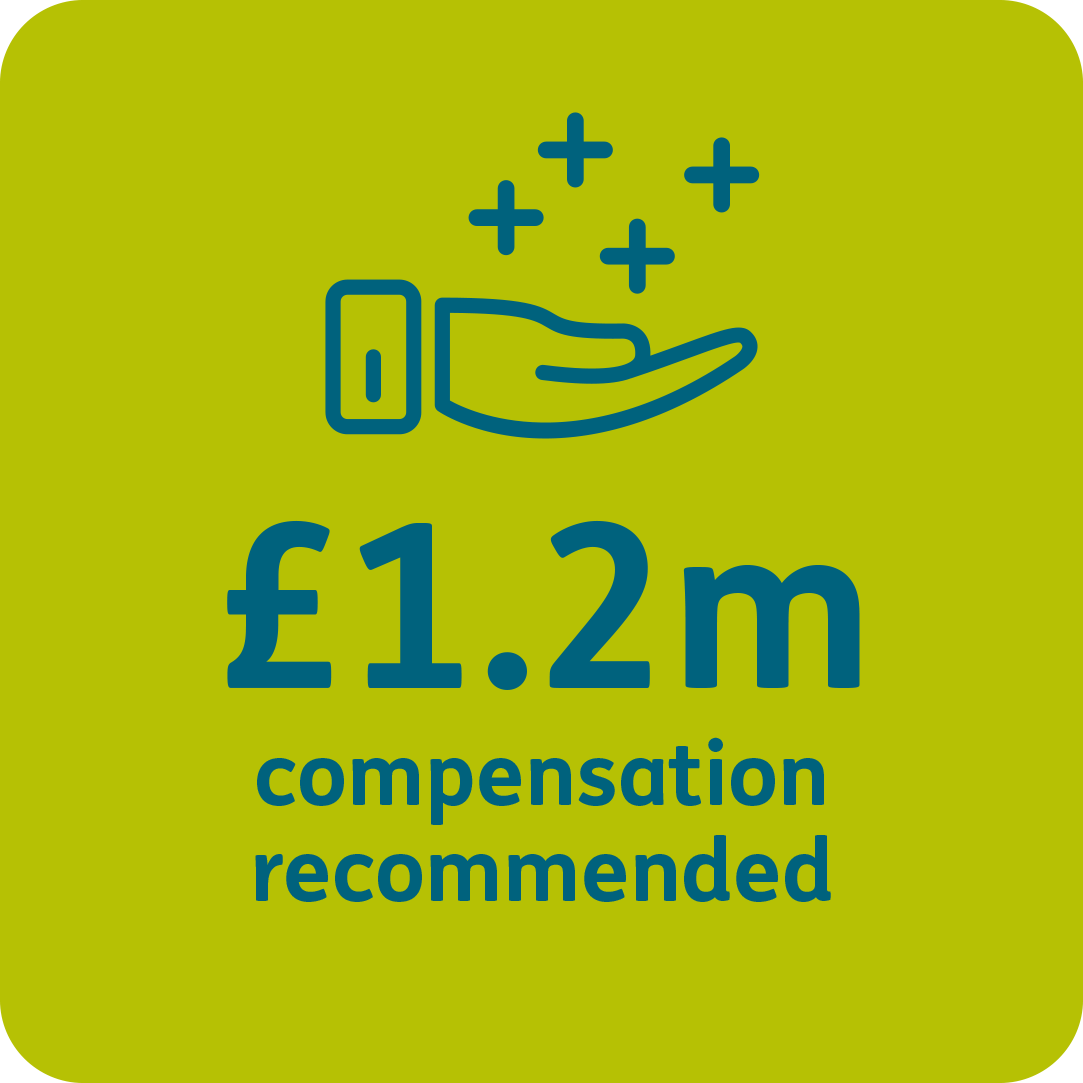
We ordered a total of £4.8 million in compensation and recommended a further £1.2 million across over 14,000 findings. This is around 10% more compensation than we ordered and recommended the previous year, slightly less than the increase in upheld findings.
Compensation was the most common order across all complaint categories except Information and Data Management, where we ordered apologies and case reviews more frequently.
We are proportionate in our orders of compensation. They are calculated according to a framework that we created following engagement with landlords and residents. The framework was designed with fairness in mind and this is available on our website.
The average amount of compensation ordered per case has fallen steadily over time. In 2023-24 we ordered an average of £1,151 per upheld case, falling to £947 in 2024-25. This went down again in 2025-26, with average compensation per upheld case at £703. This reflects decreasing severity in complaint outcomes compared to prior years, which is also demonstrated by the reduction in severe maladministration findings.
Over 65% of compensation ordered in 2025-26 followed complaints about Responsive Repairs (£3.3m). The average compensation order made for Responsive Repairs was £623, followed by Planned Works (£448).
Within the Responsive Repairs category, complaints about Leaks had the largest average compensation amount (£827). Condensation, damp and mould had the highest total compensation ordered (£1.1m) for 2025-26. The large amounts of compensation paid speak to the disruption and distress caused by living with leaks, damp and mould.

In 34 cases we made compensation orders of more than £5,000 – more than 10 times the average amount. Responsive Repairs featured in 74% of these cases.
High awards are often linked to prolonged service failures and a lack of resident-centred decision-making. Across repairs cases with the highest compensation orders, we observed:
-
- inadequate communication
- poor knowledge and information management
- failure to comply with the complaints policy and timescales
Multiple failures also compound service delivery issues, prolonging residents’ inconvenience and delaying effective resolution.
We have published our guidance on compensation, which sets out our expectations for redress and how we calculate the amounts we order. We are planning to release our first issue of statutory Good Practice on compensation.
-
-
Apologies
Compensation is not the only remedy to resolve a complaint. Apologies are a valuable step in repairing trust between a resident and their landlord.
We ordered landlords to make 6,120 apologies to residents for poor handling of their case. There were 32 cases where an apology was the only order we made.
Our apologies guidance says:
“A timely apology given as soon as the problem is understood is most effective. The sooner an apology is given, the sooner the trust and relationship between the landlord and resident can begin to mend.”
-
Wider orders
We make ’wider orders’ where we think the landlord should look beyond a single complaint and fix broader problems in policy or practice. We made 16 wider orders in 2025-26. The majority were in Responsive Repairs (10), of which 7 were about the landlord’s approach to condensation, damp and mould. The others were made in findings on:
-
- complaints handling (2)
- temporary moves (2)
- ending a tenancy (1)
- information and data management (1)
We ordered 15 landlords to undertake policy or practice reviews. 9 reviews were complied with on time. Landlords conducted most of the reviews internally, but some landlords commissioned external assistance. External reviews often identified issues beyond the initial service area, such as system weaknesses and poor staff training. For some cases, the landlord had commissioned an external review prior to receiving our determination and linked the reviews together.
These reviews often resulted in significant changes to process. At least 4 resulted in a new policy being developed by the landlord. Others led to process improvements or changes to how records were kept, including records of residents’ vulnerabilities. The learning from wider orders underlines how every complaint is an opportunity to learn, reflect, and improve services.
-

Equality, diversity, and inclusion
When someone brings a complaint to us, we ask them for details about themselves. This information can help us to understand the services provided by landlords and ensure fairness in our processes. Our equalities data for residents complaining to us is not complete, as about one third of respondents did not disclose information on each question.
In 2025-26, 64% of the complaints we determined were made by women and 29% by men. 7% of complainants provided no gender or preferred not to disclose. Less than 1% were intersex or non-binary.
33% of the residents whose case we determined said that they have a disability. Long term medical conditions and mental ill health were the most commonly reported disabilities. 23% said they had no disability and 6% preferred not to say. 38% did not respond.
39% of residents reported their ethnicity as white, followed by 33% who did not answer the question. 7% were black, 3% were Asian, 5% mixed or multiple ethnicity and 8% described themselves as ‘other’. 7% of respondents preferred not to say.
Residents’ experiences are shaped by many stages of service delivery and complaints handling before a case reaches us. As a result, these figures should not be interpreted as evidence that demographic groups experience social housing services differently. However, they do highlight the importance of robust equalities data. We encourage landlords to collect, store and use residents’ information so they can identify patterns, understand whether services are meeting needs, and make improvements.
Individual landlord performance
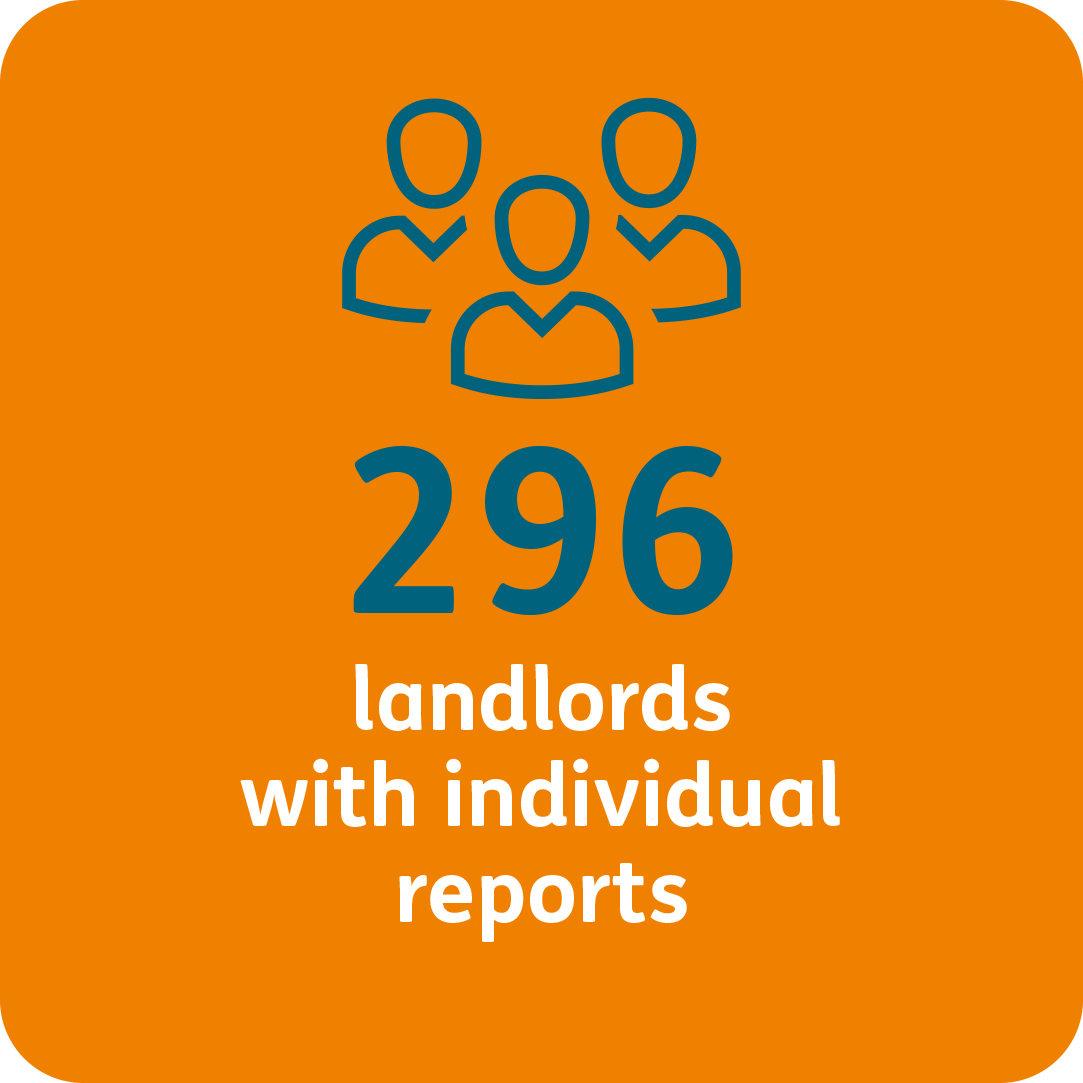
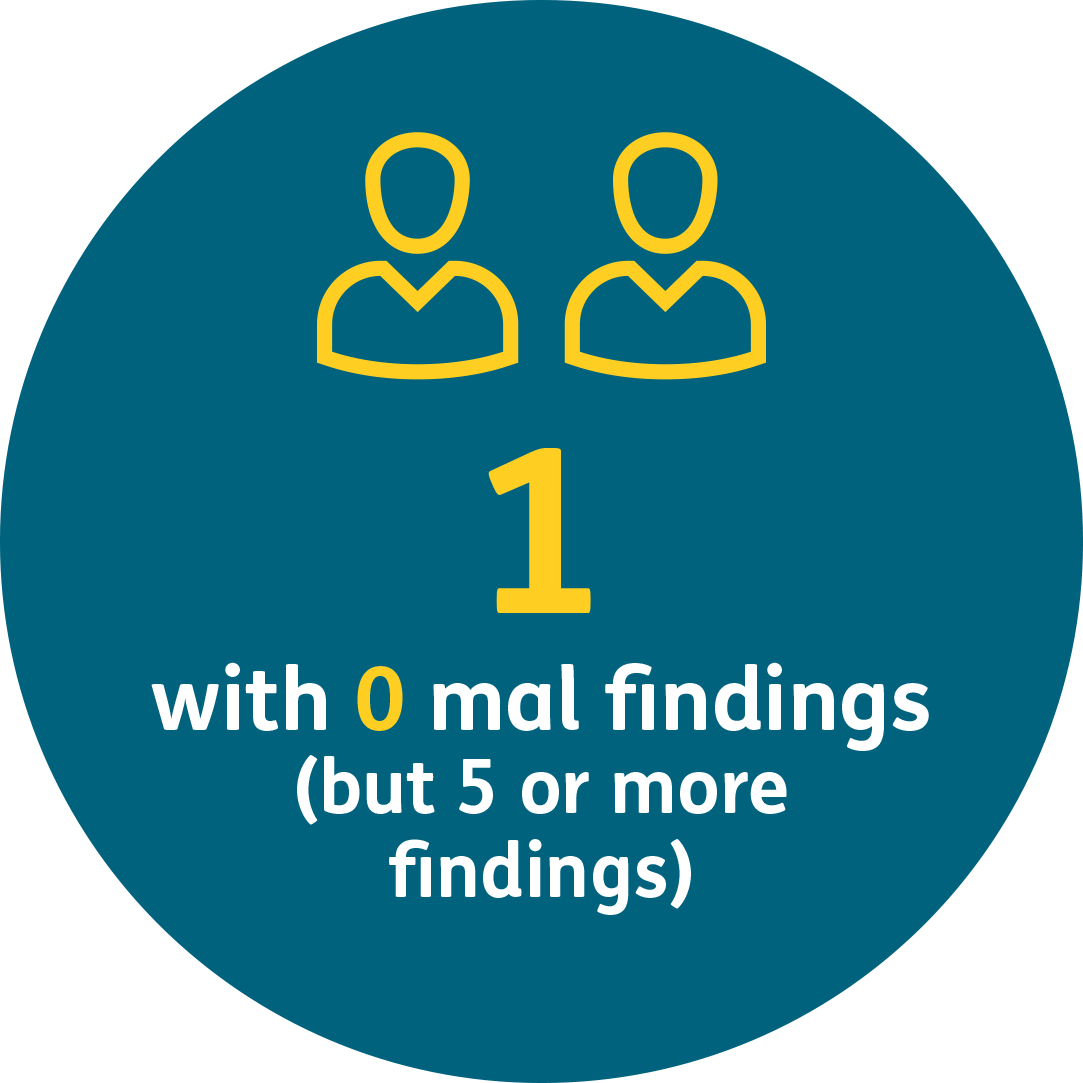
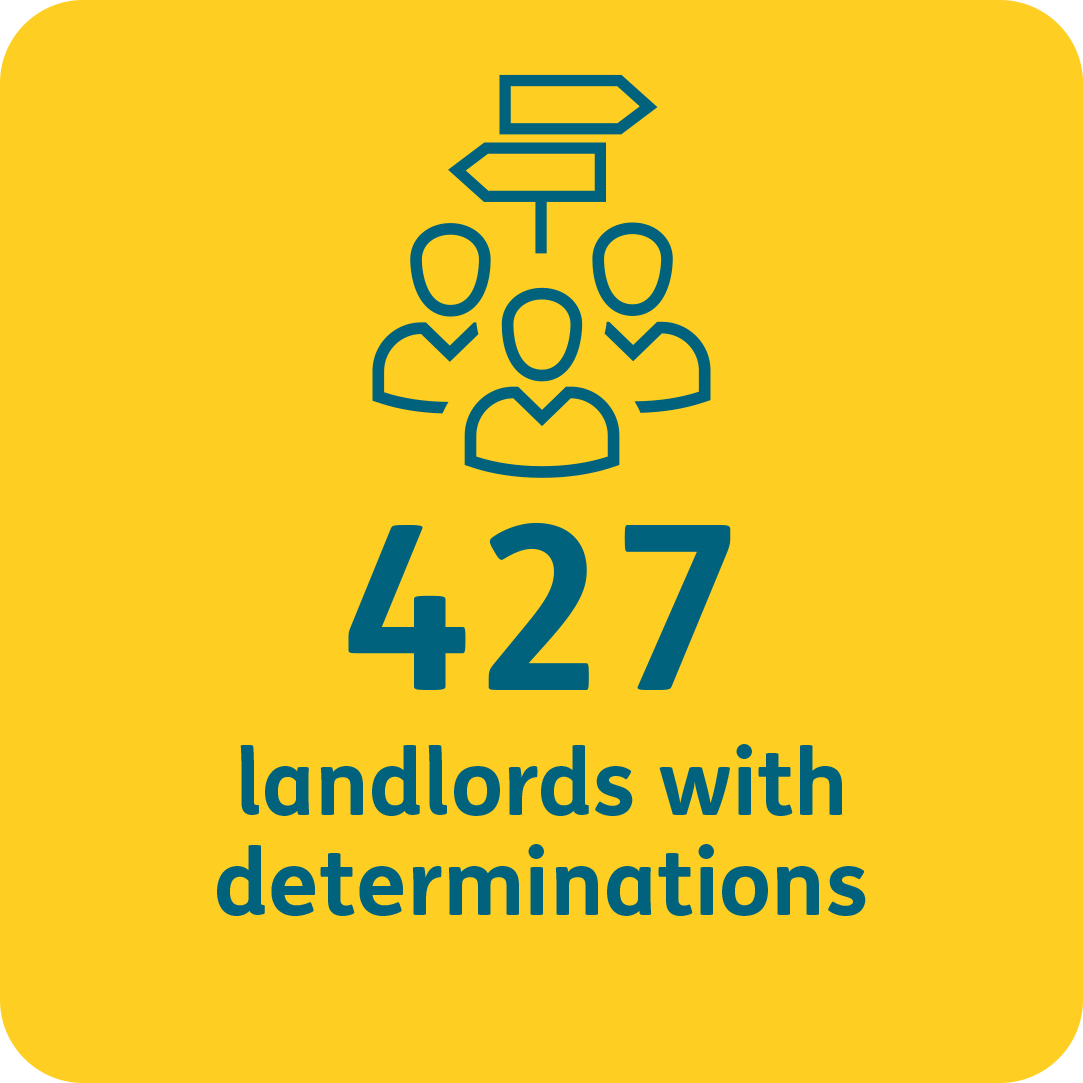
Individual landlord performance reports are issued to landlords with 5 or more findings in investigations issued that year. There are 296 landlords with performance reports for 2025-26.
These reports provide landlords with more detail on their performance. This includes an overview of the cases that came to us last year and how they compare to other landlords of a similar size and type.
These are important reports for the landlord’s Member Responsible for Complaints to review and discuss. Landlords can use the reports in tandem with the ACR and accompanying dataset. The reports can help landlords to understand how they compare to similar landlords and to contextualise any changes since 2024-25.
What this means for landlords
Our 2025-26 findings suggest the sector’s complaint handling is improving overall, sustaining the trends we observed in 2024-25. We urge our member landlords to use complaints to keep making improvements in services for residents. We will continue to support this with our interventions, decisions, remedies, and wider orders.
Landlords can reflect on 3 key areas for action.
- Repairs as the priority area: landlords should treat repairs handling, especially damp, mould and leaks, as the area with greatest potential impact on resident wellbeing and housing standards.
- Awaab’s Law readiness: We encourage landlords to audit whether their complaints handling teams can reliably identify when a case falls under Awaab’s Law. This should also identify whether they can respond within appropriate timescales. Early insights from cases we have determined in 2026-27 suggests that landlord teams are struggling to do so.
- Complaints handling comparison: Our process change means that landlords can track and compare performance in complaints handling across time. This can support landlords to make sense of their own complaints handling performance and make improvements where needed.
Our Centre for Learning has eLearning modules and workshops to give housing professionals free-to-access materials to improve services. It also has case studies, reports, podcasts, and other resources about significant topics the sector is facing.
We will consider what further learning and insights we can share during 2026-27 to help improve landlords’ complaint handling and service delivery.