Q3 Quarterly Data 23-24
In this quarter, from October to December 2023, we made 1,212 determinations.
On this page
This page refers to Complaint Handling Failure Orders (CHFOs), which was our process at the time of publication. We now issue Complaint Handling Failure Notices (CHFNs) in these circumstances. View the latest information on how we bring landlords into compliance in casework.
Complaints received
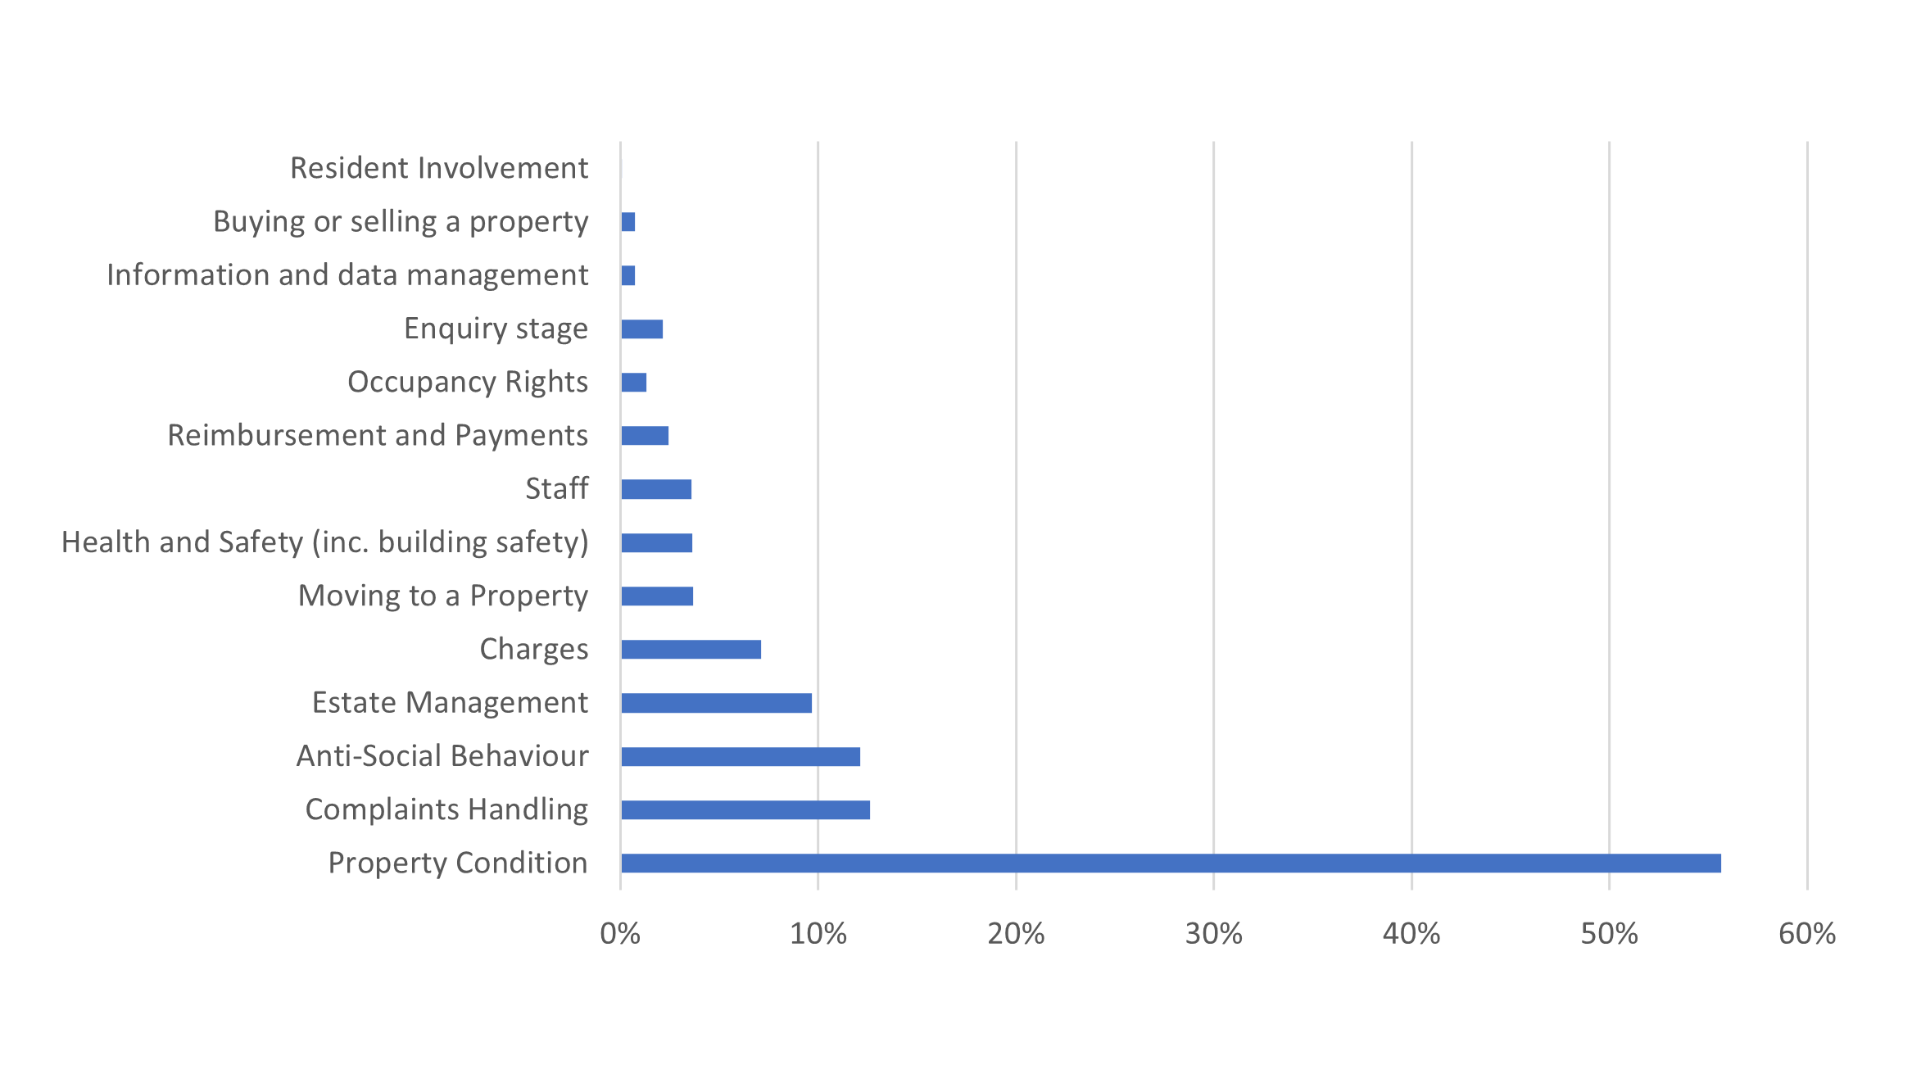
The complaint categories graph shows that ‘property condition’ was once again the most complained about category, with 56% of all complaints. That compares to the second highest ‘complaint handling’, at 13%.
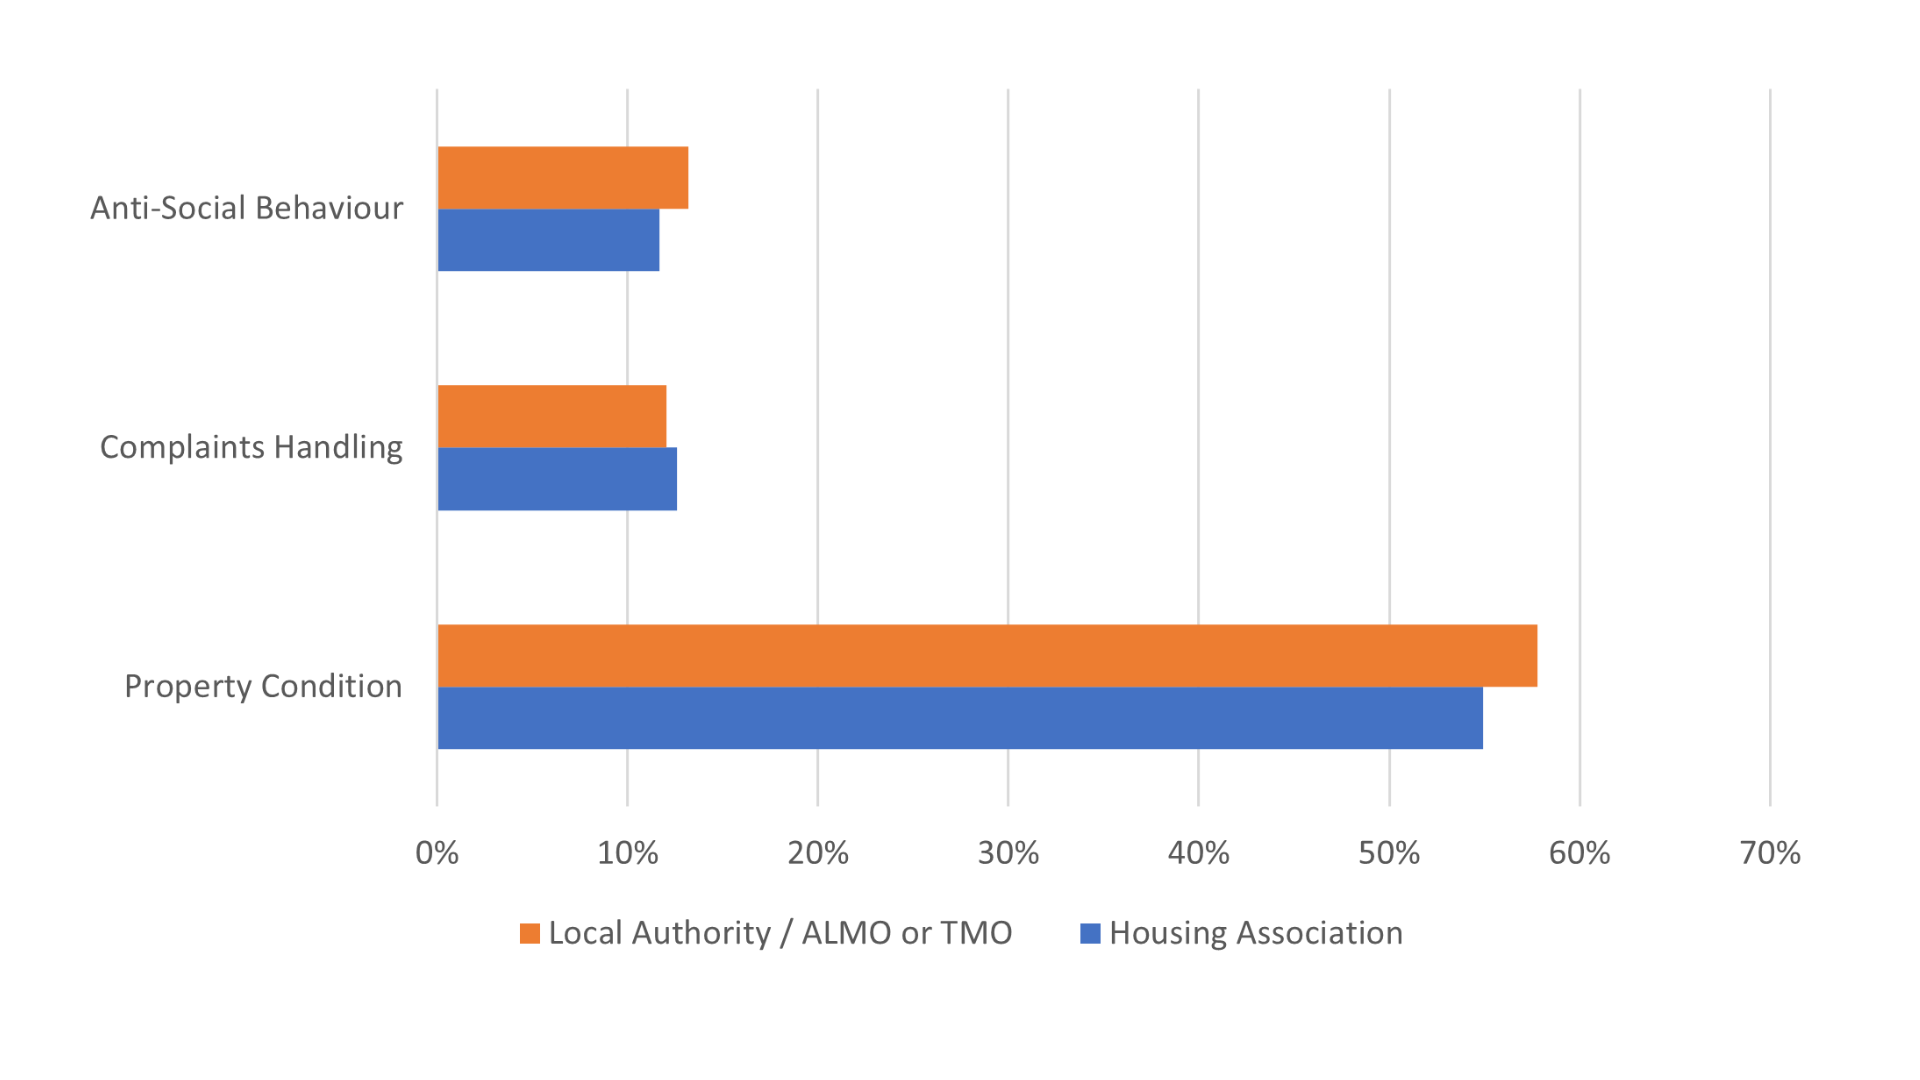
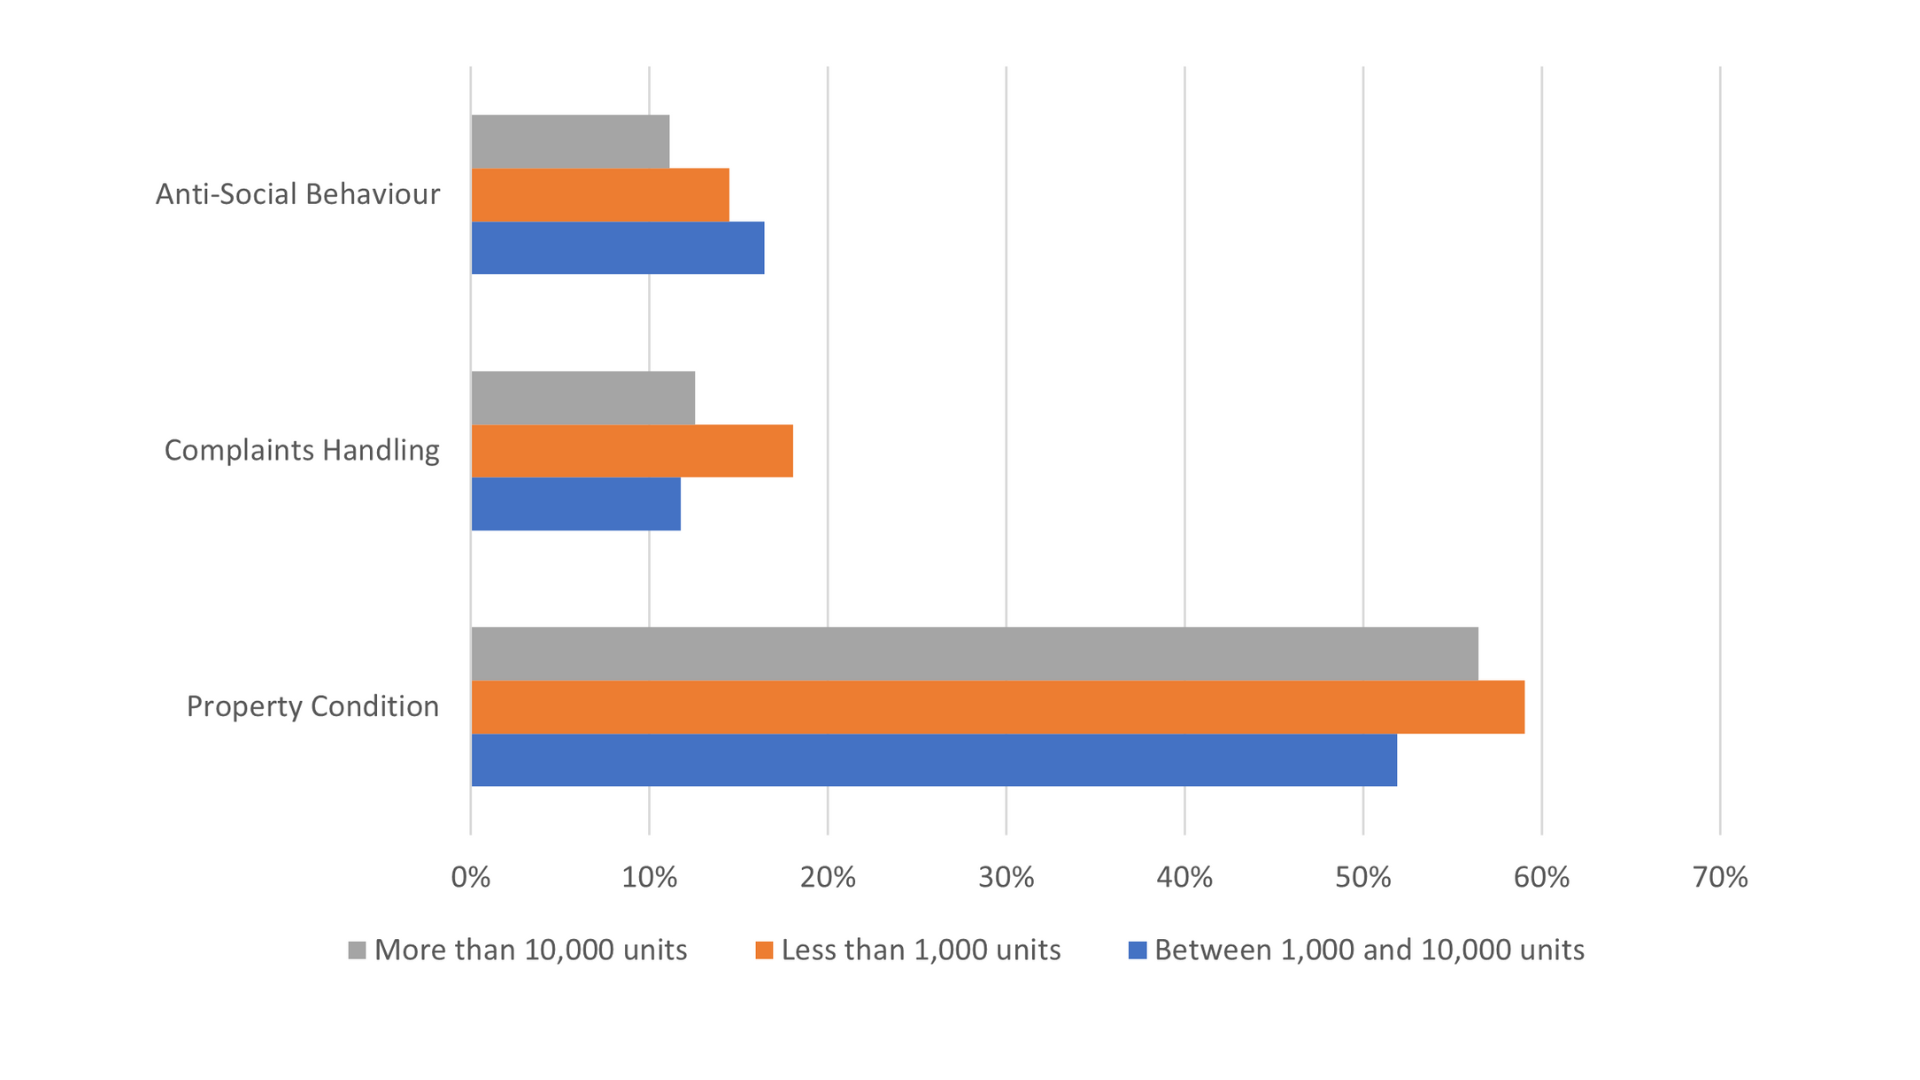
The following 2 graphs show how many complaints we receive from different types of landlords and different sizes regarding the top 3 complaint categories (property condition, complaint handling and antisocial behaviour).
Complaint categories
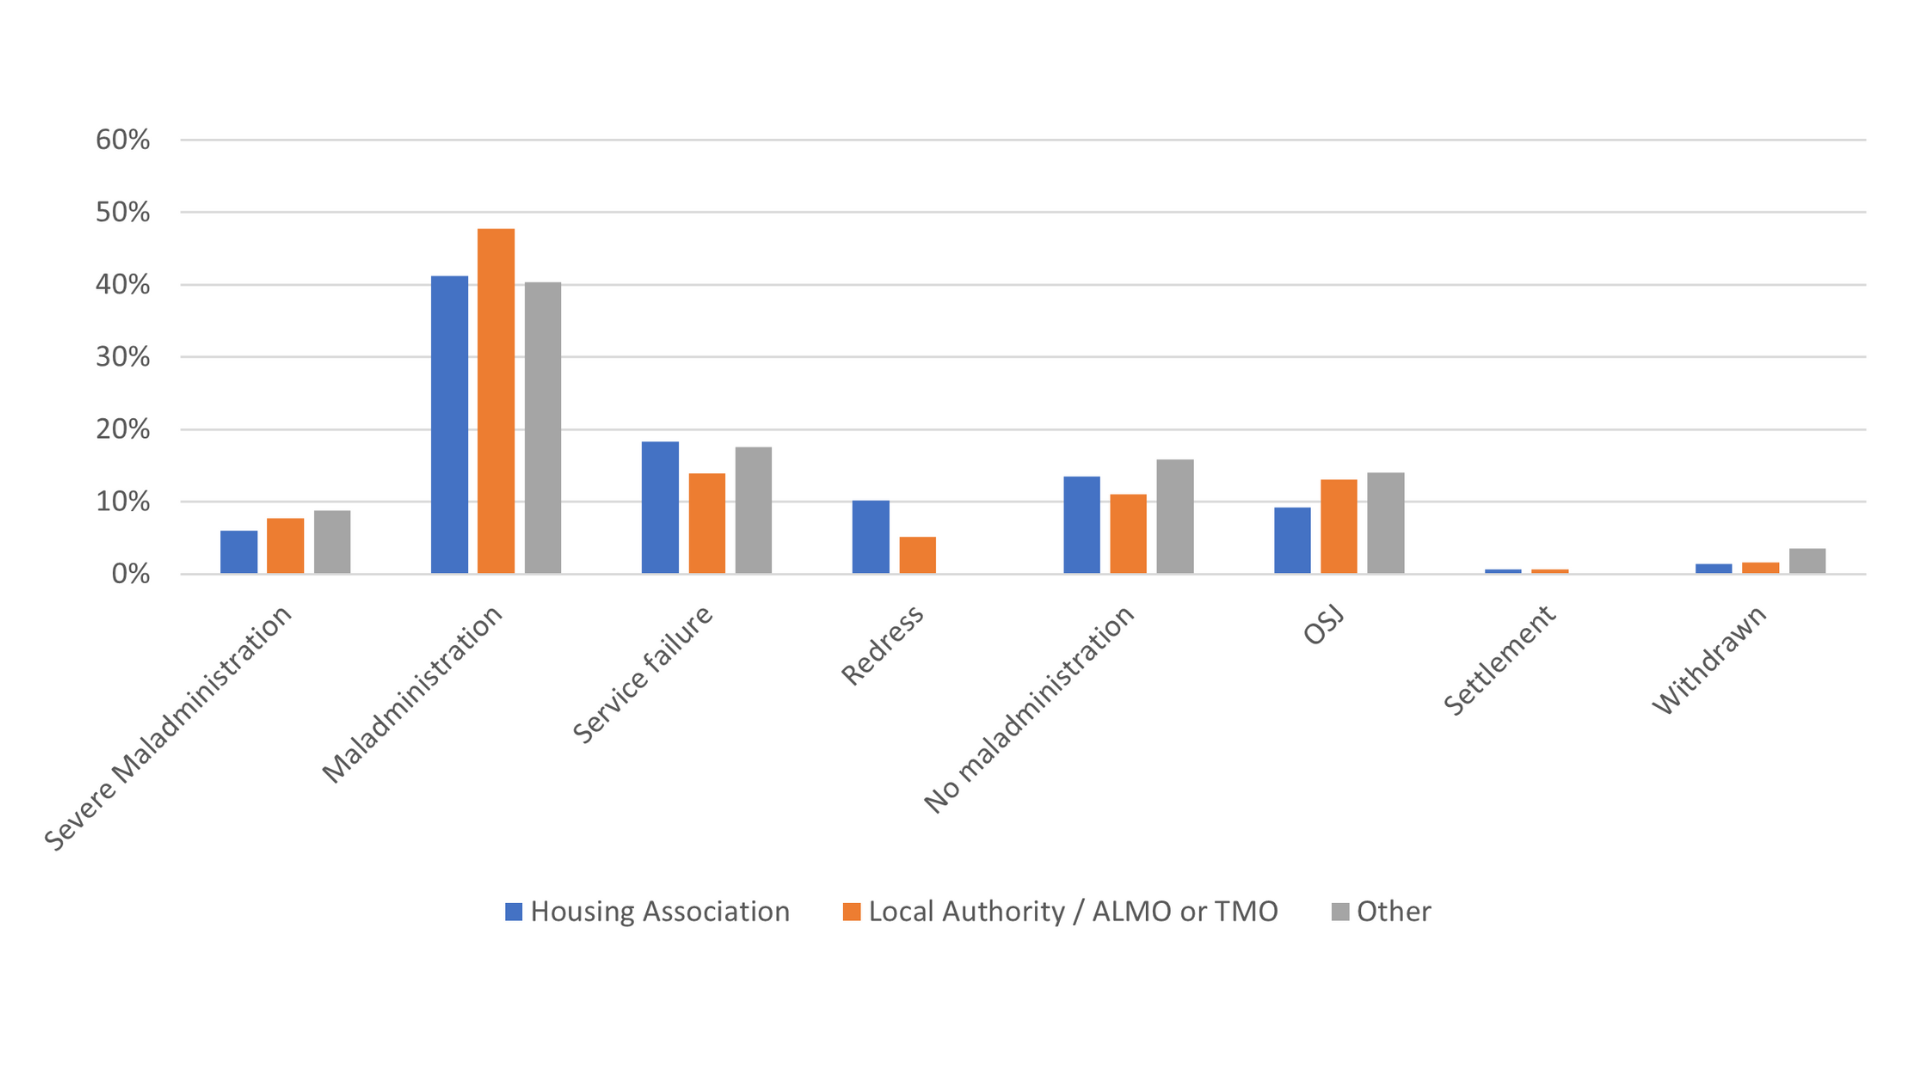
Type of landlord
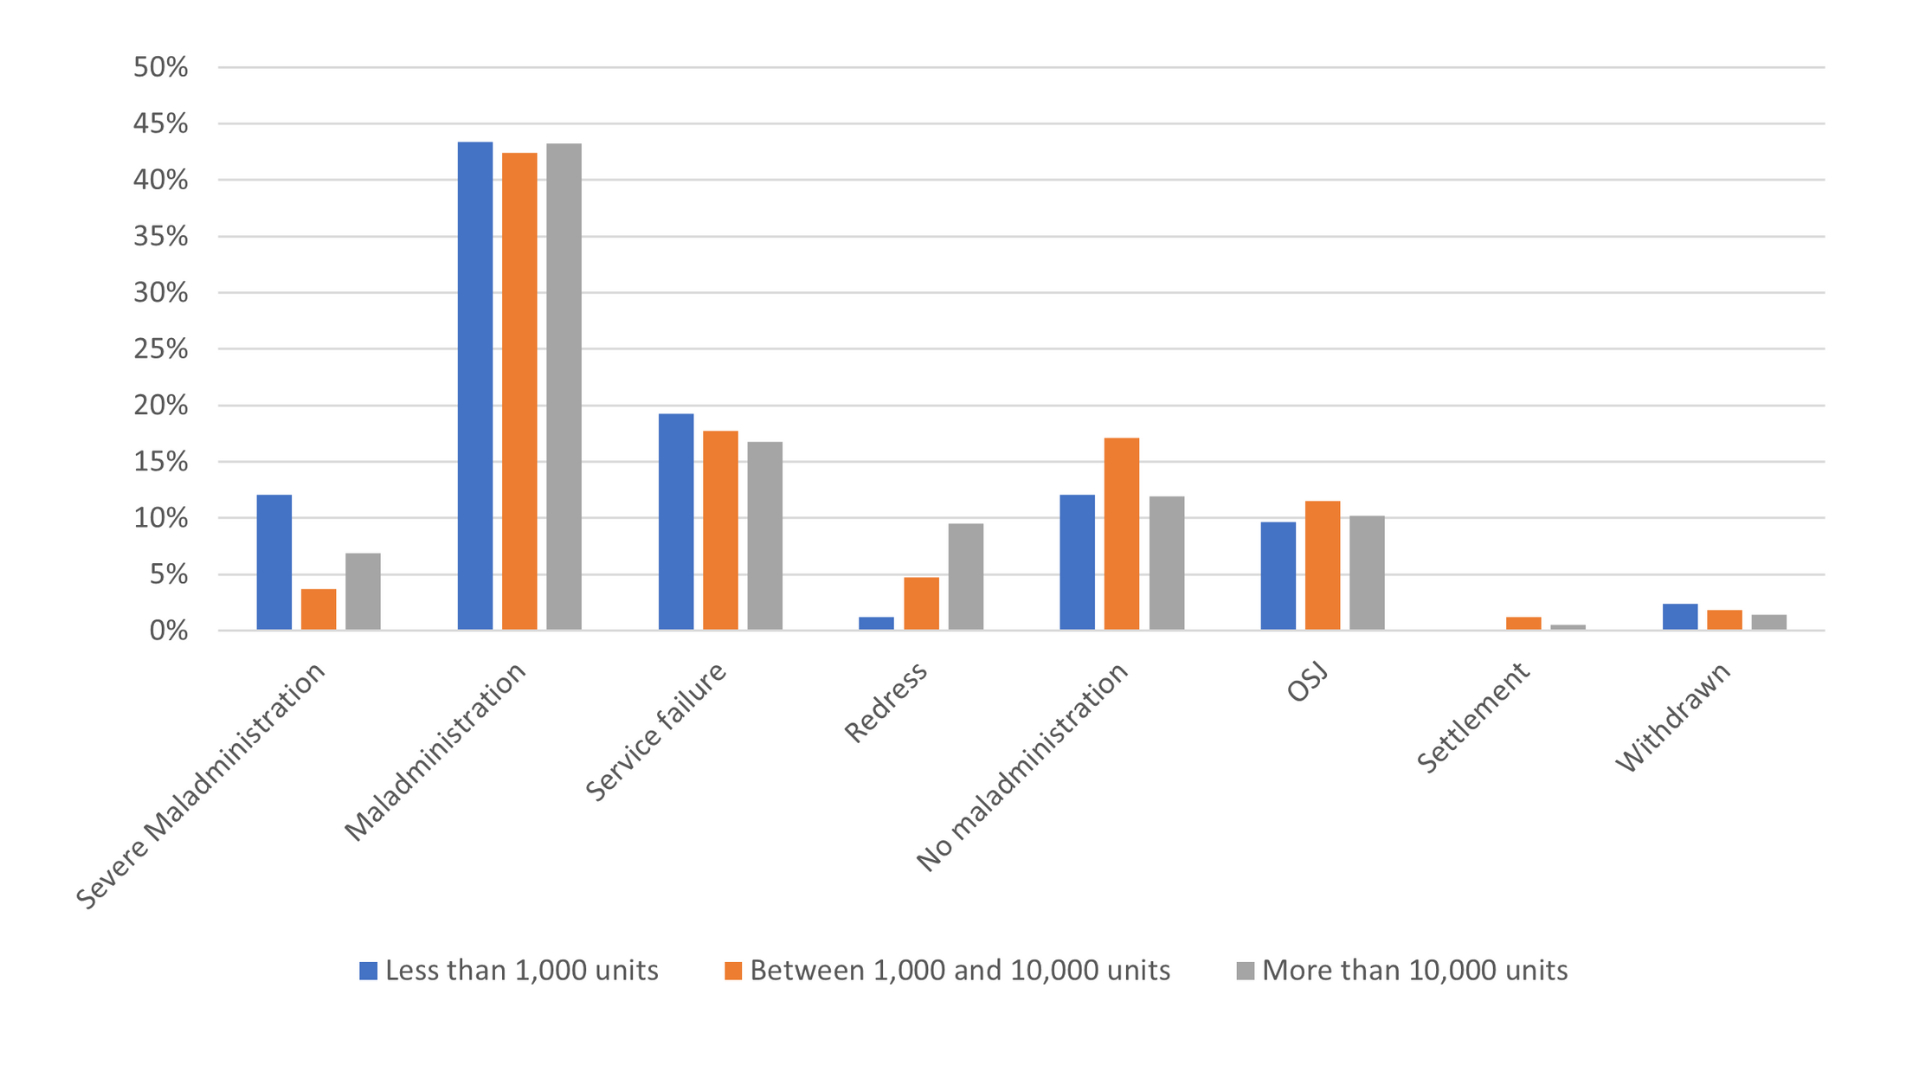
Size of landlord
Determinations
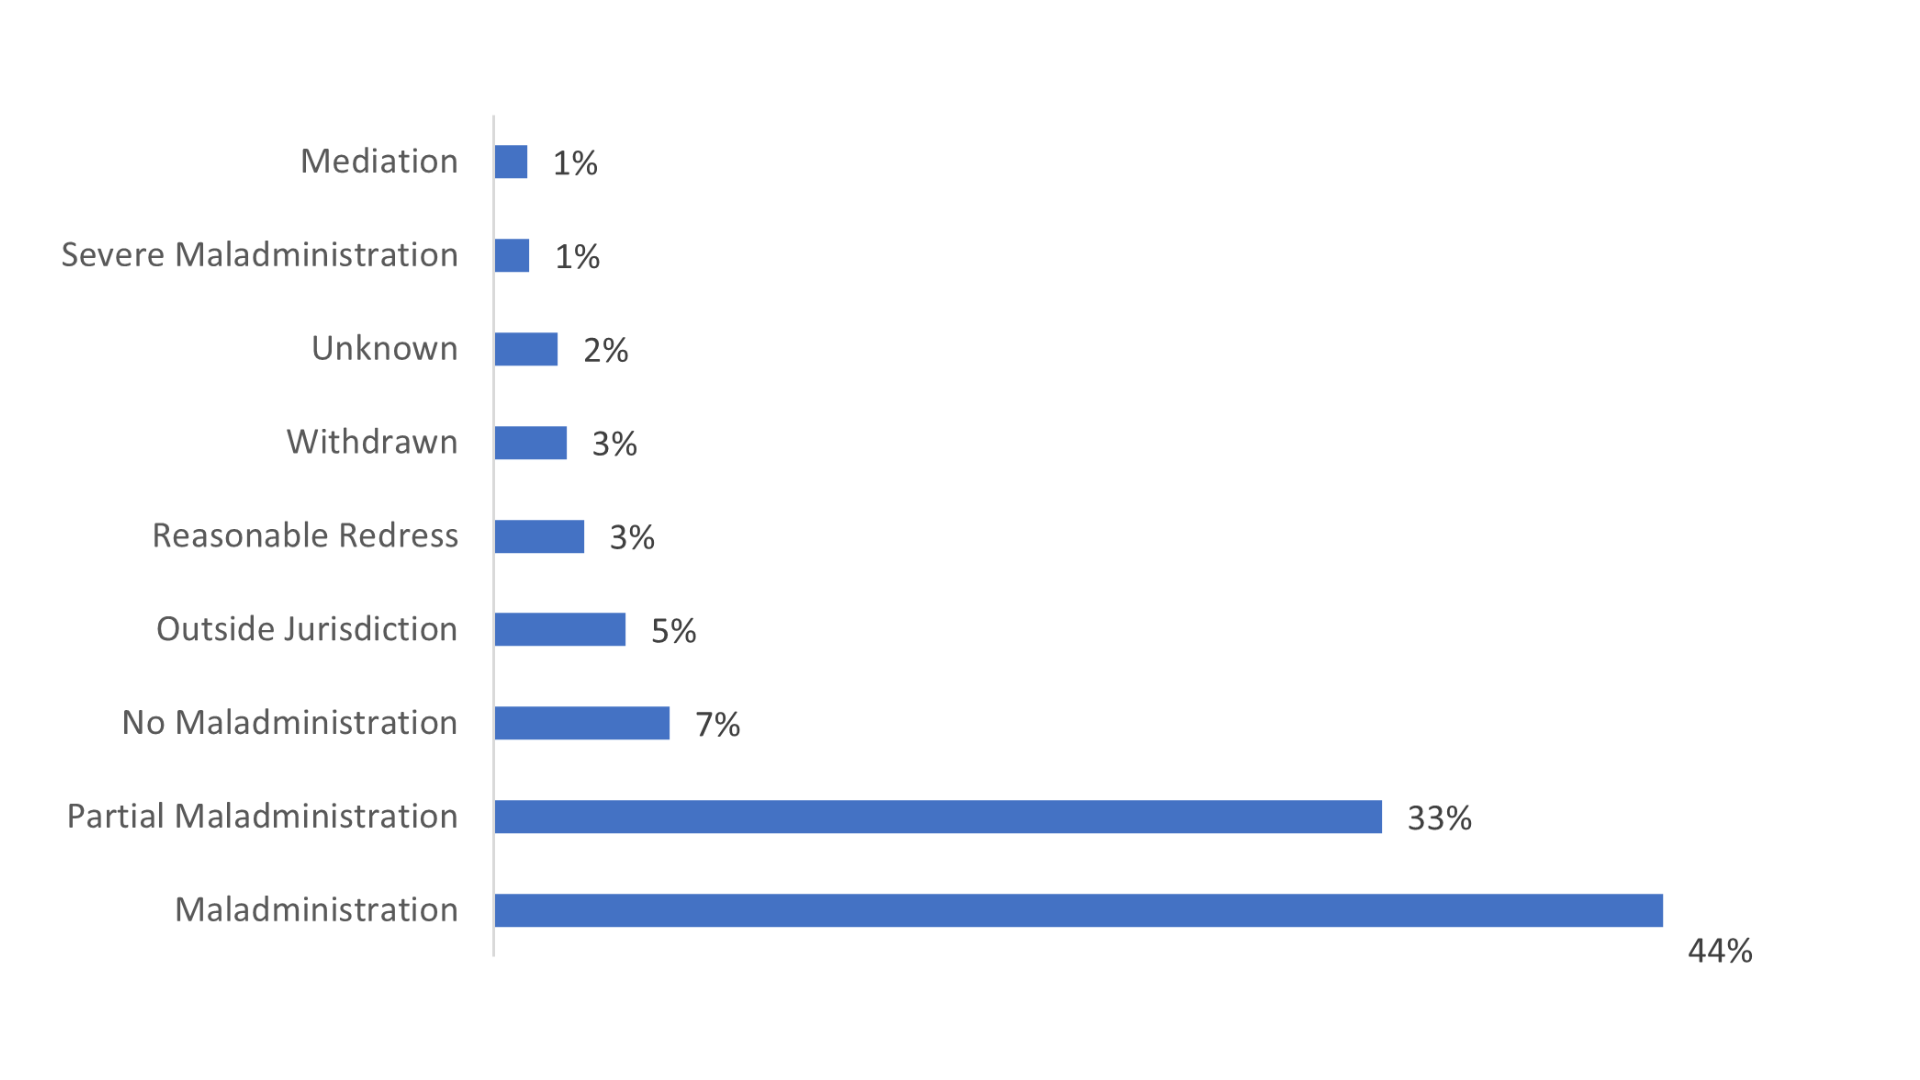
This graph shows how we found maladministration (whether that be severe, partial, or maladministration) in 78% of cases in the quarter.
% of determinations
Category findings
These graphs show how the different category findings relate to the top 3 complaint categories, the different types of landlords, and the different size of landlords.
Different category findings
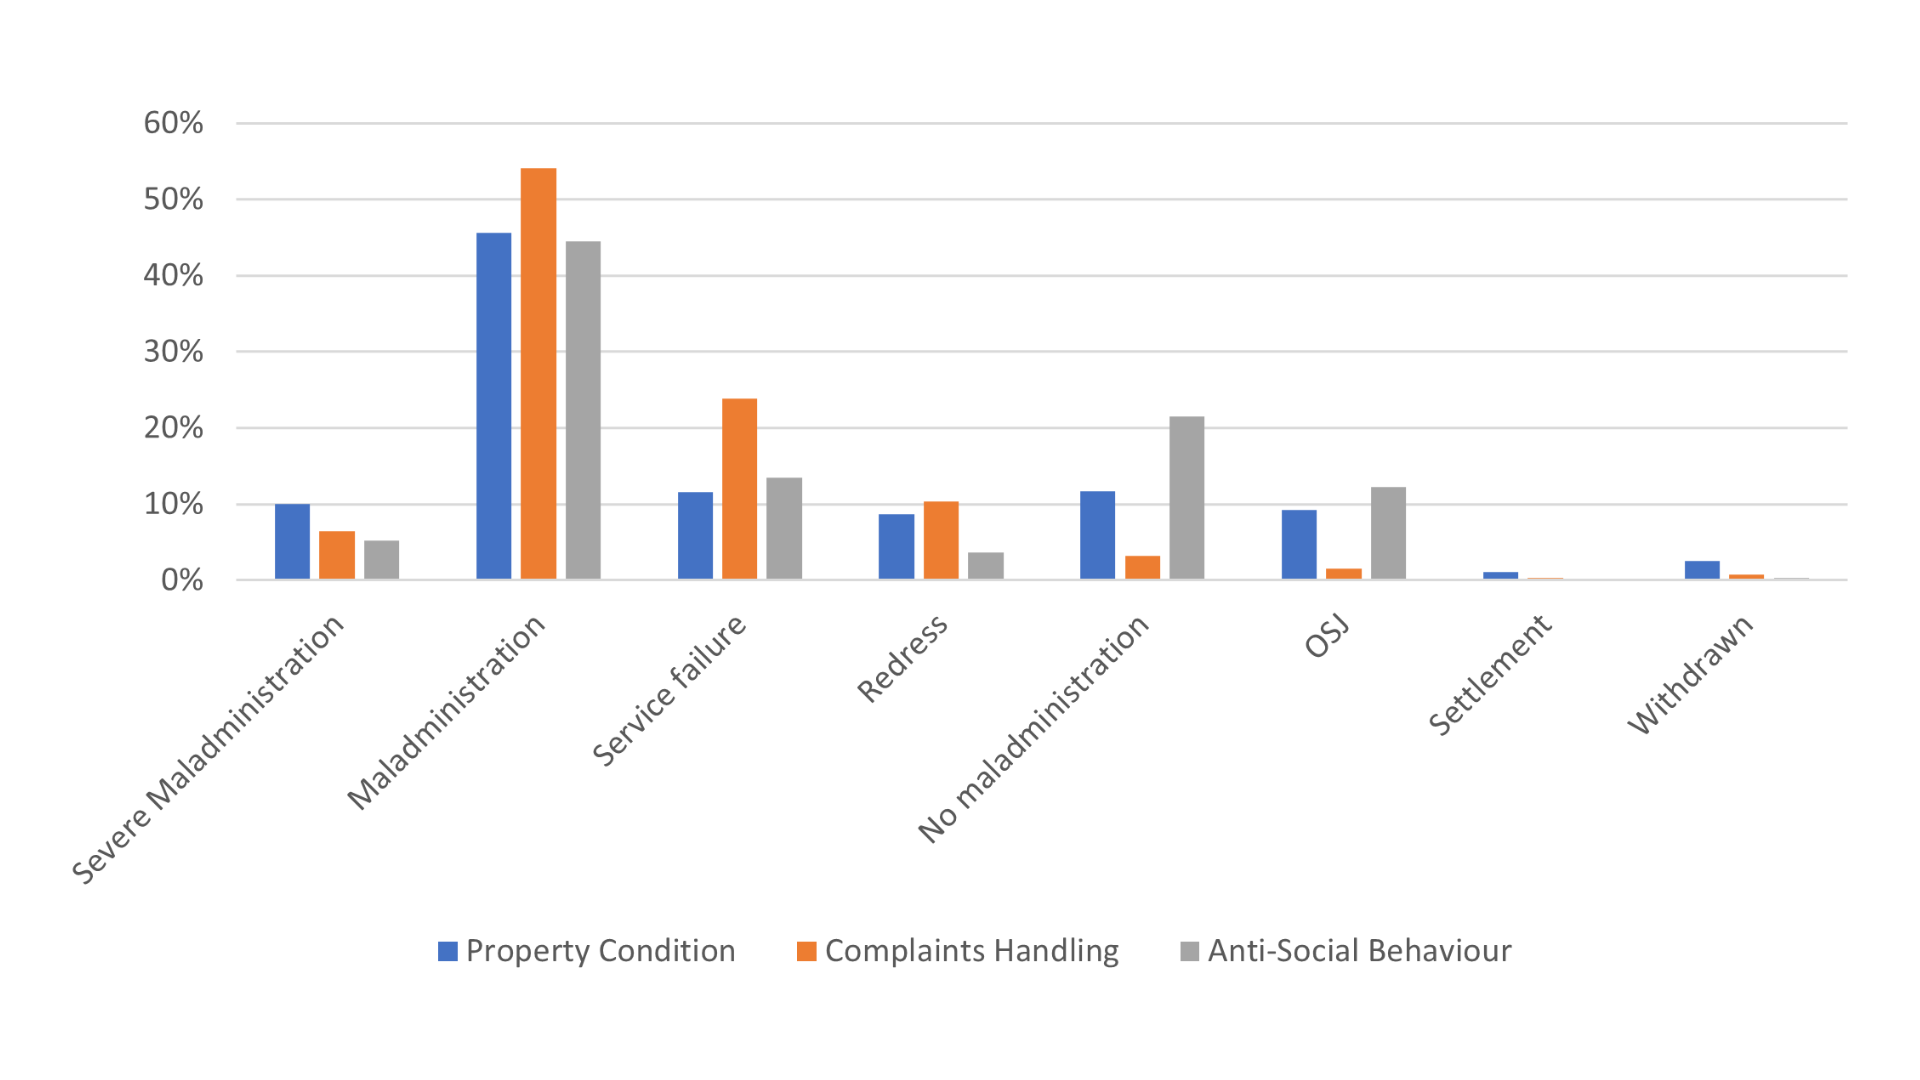
Type of landlord
Size of landlord
Orders and recommendations
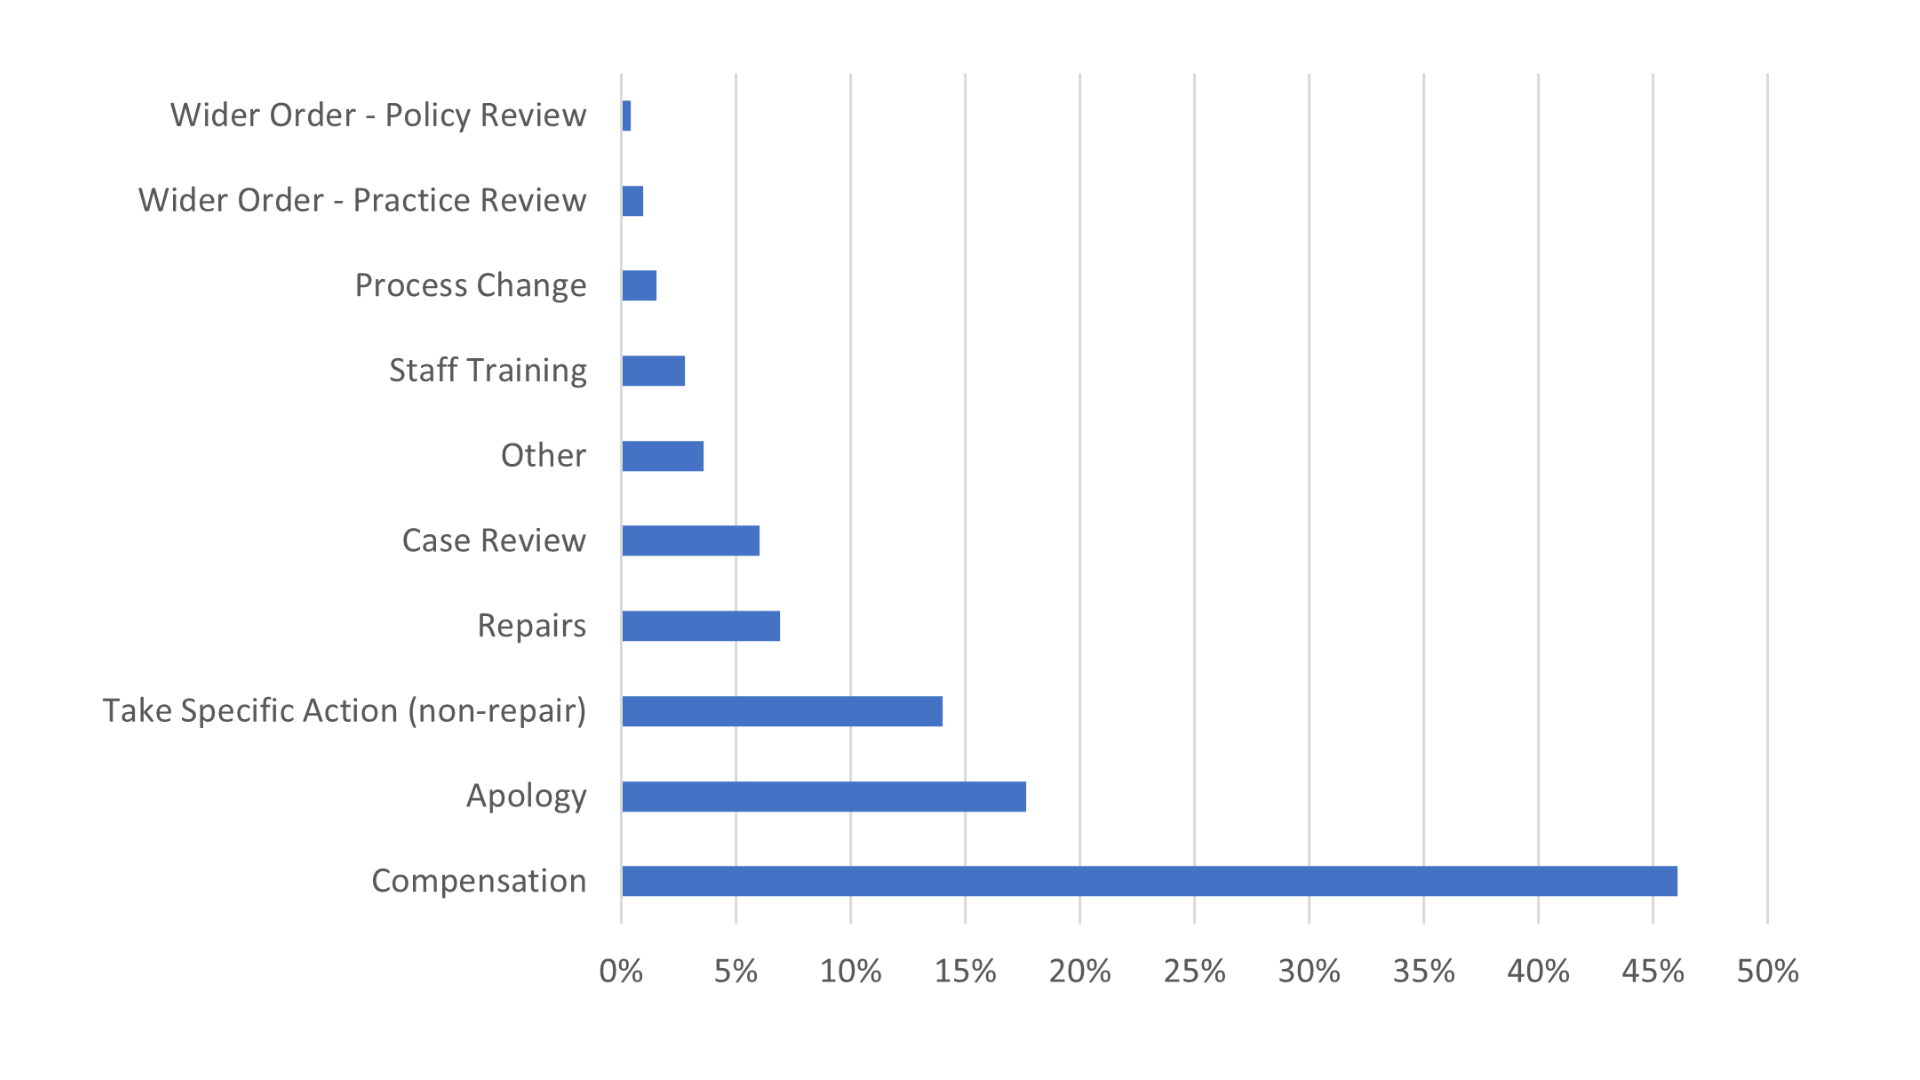
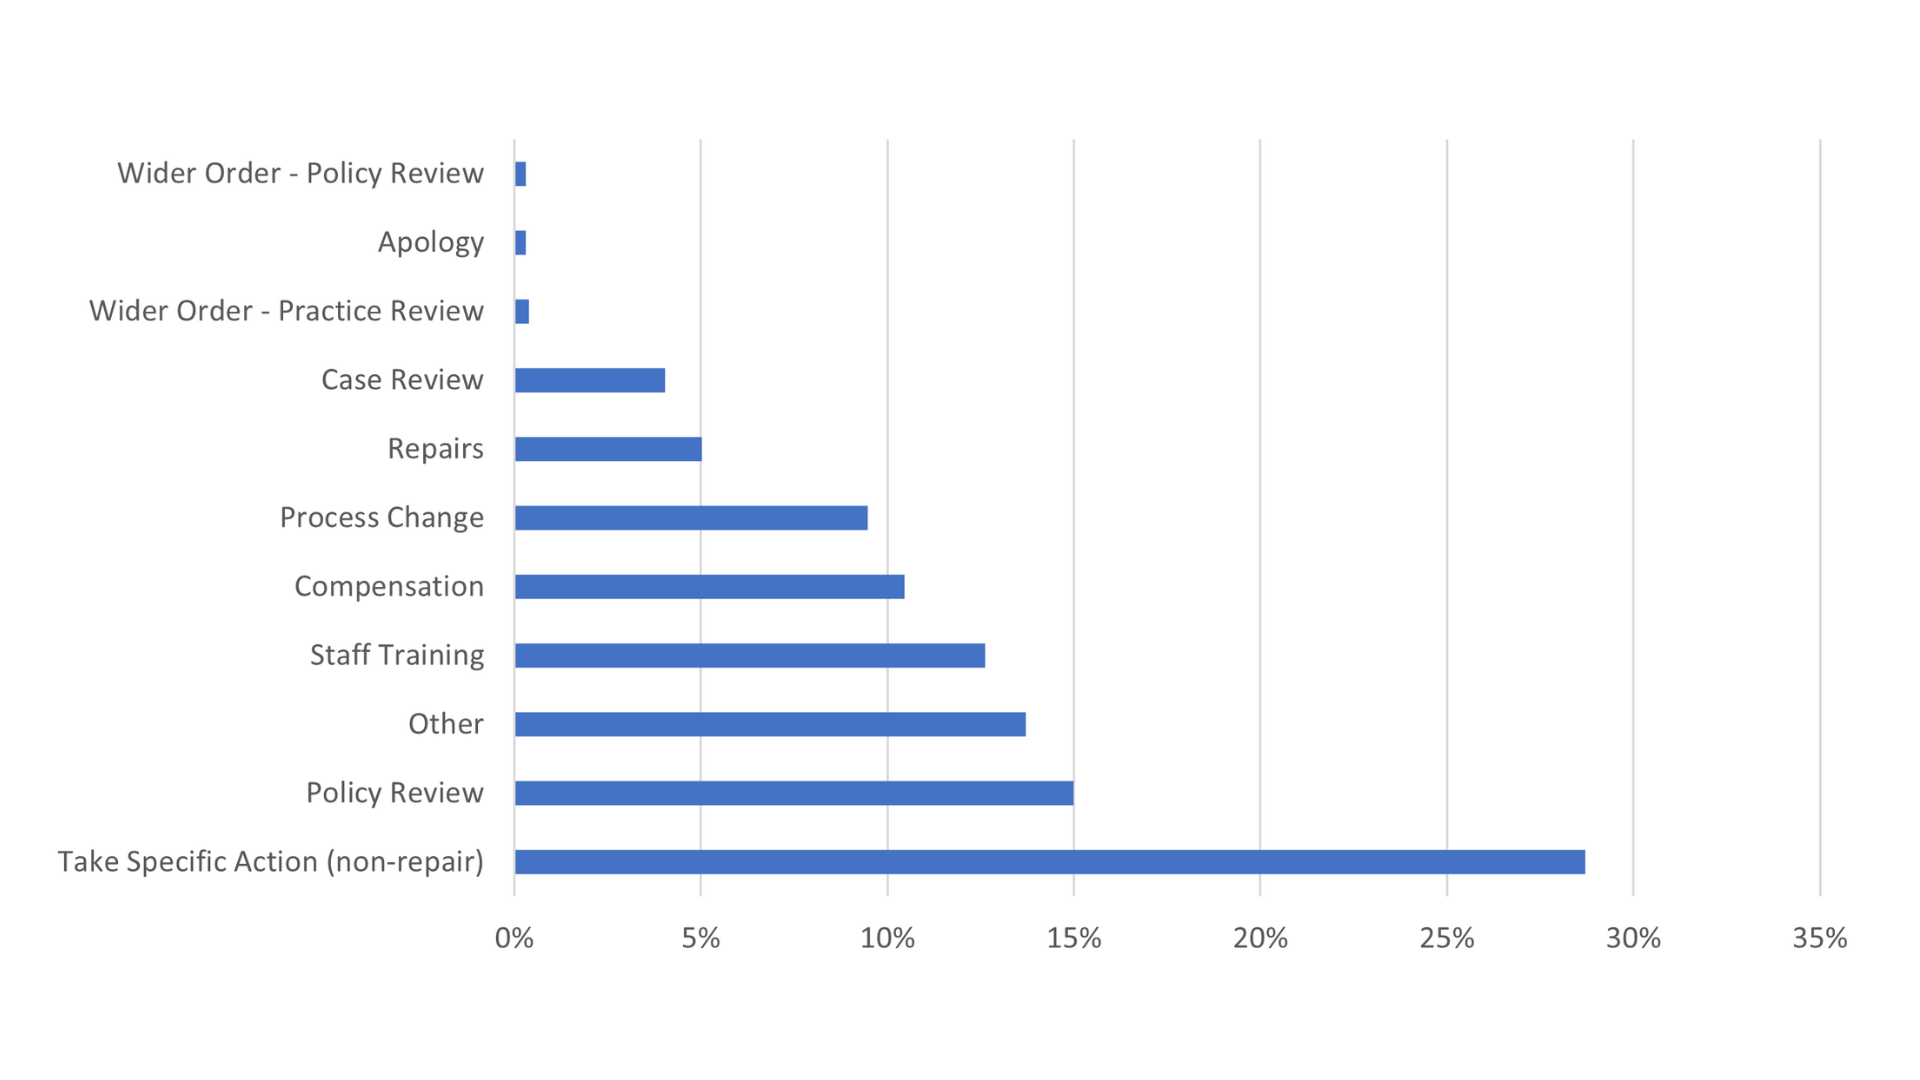
The orders given to landlords graph shows that in 46% of cases, we ordered landlords to pay residents compensation. And the recommendations given to landlord’s graph shows that in 29% of cases, we recommended that the landlord take non-specific action (usually something that is outside a repair).
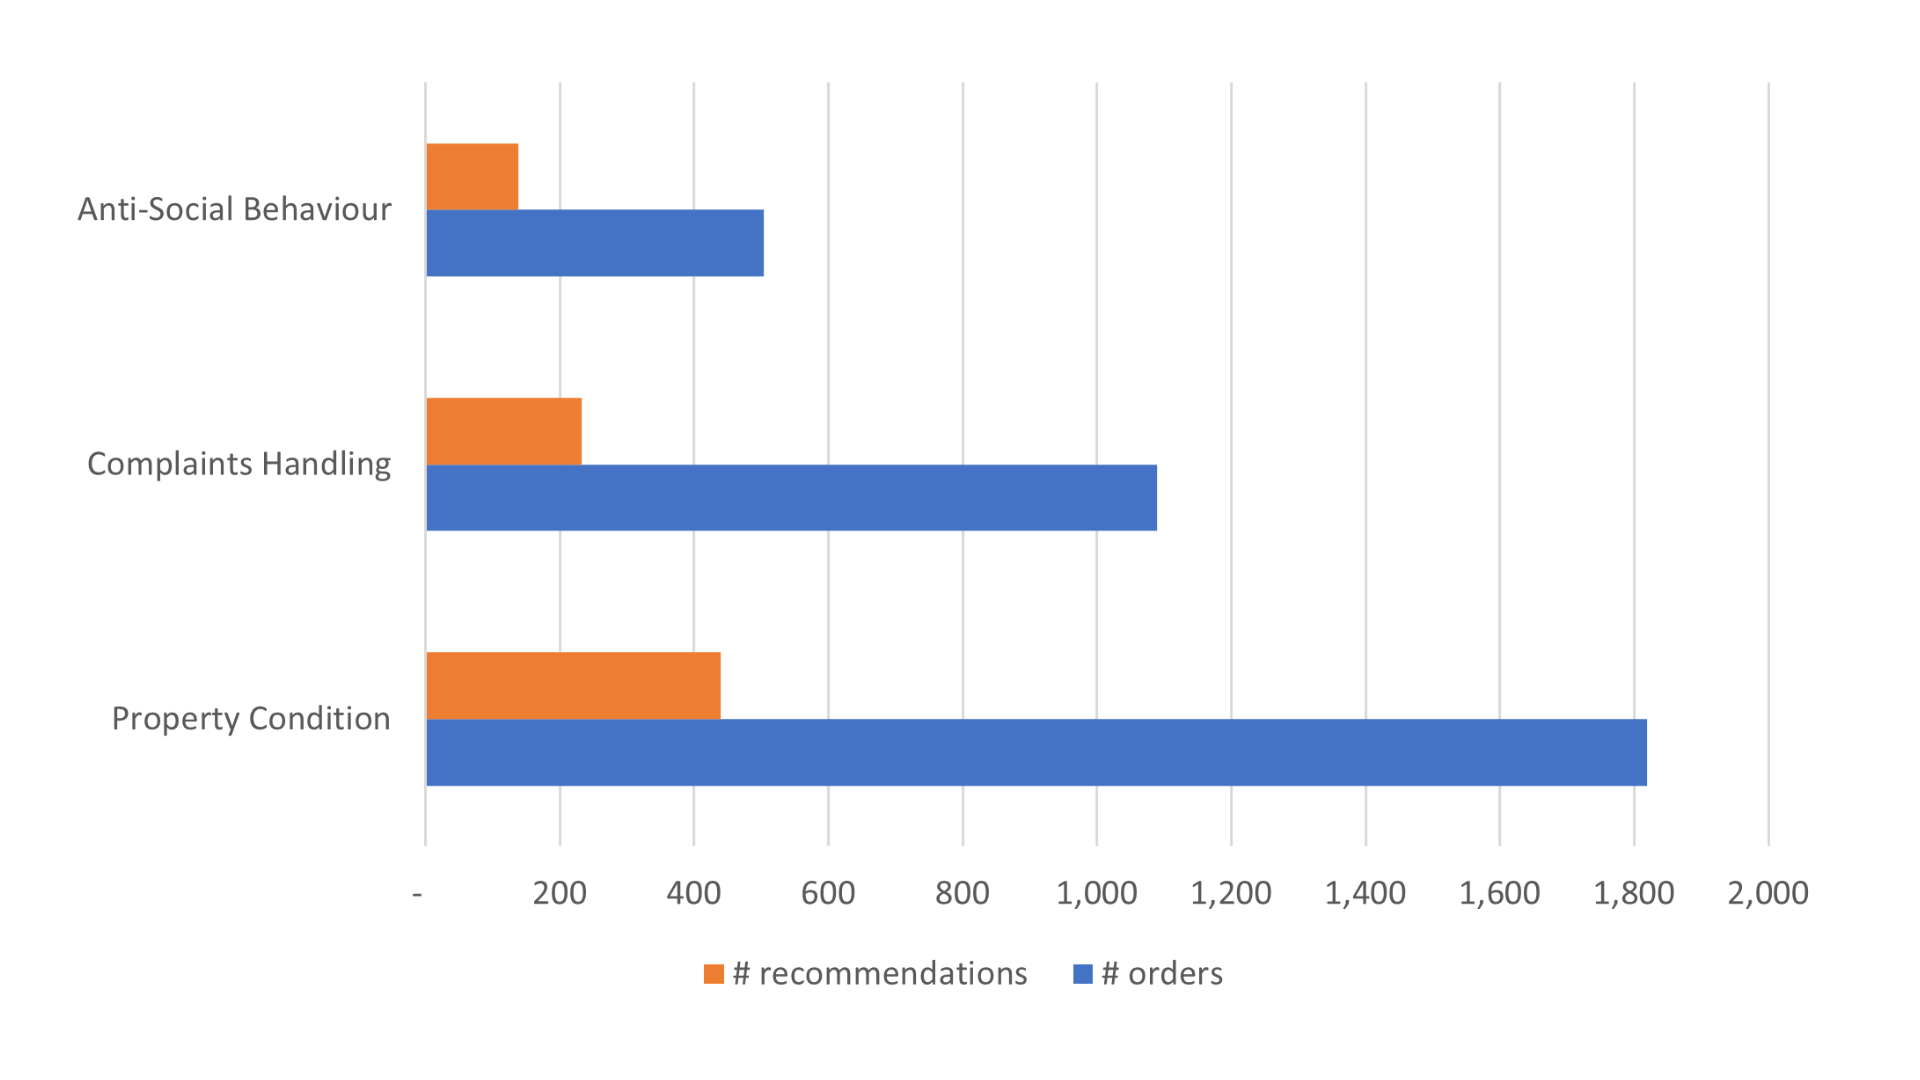
The final graph shows how many orders and recommendations we’ve made based on the top 3 complaint categories.
Orders given to landlords
Recommendations given to landlords
Orders and recommendations made against top 3 complaints
* All data is provisional and subject to confirmation in the final end-year figures to be published in the annual report.
Please note that this data may be subject to change. The verified data that we publish on an annual basis in our Annual Complaints Review can be found online.