Q4 Quarterly Data 2025-26

In this quarter, from January to March 2026, we made 2,846 determinations.

This page refers to Complaint Handling Failure Orders (CHFOs), which was our process at the time of publication. We now issue Complaint Handling Failure Notices (CHFNs) in these circumstances. View the latest information on how we bring landlords into compliance in casework.

Complaints received

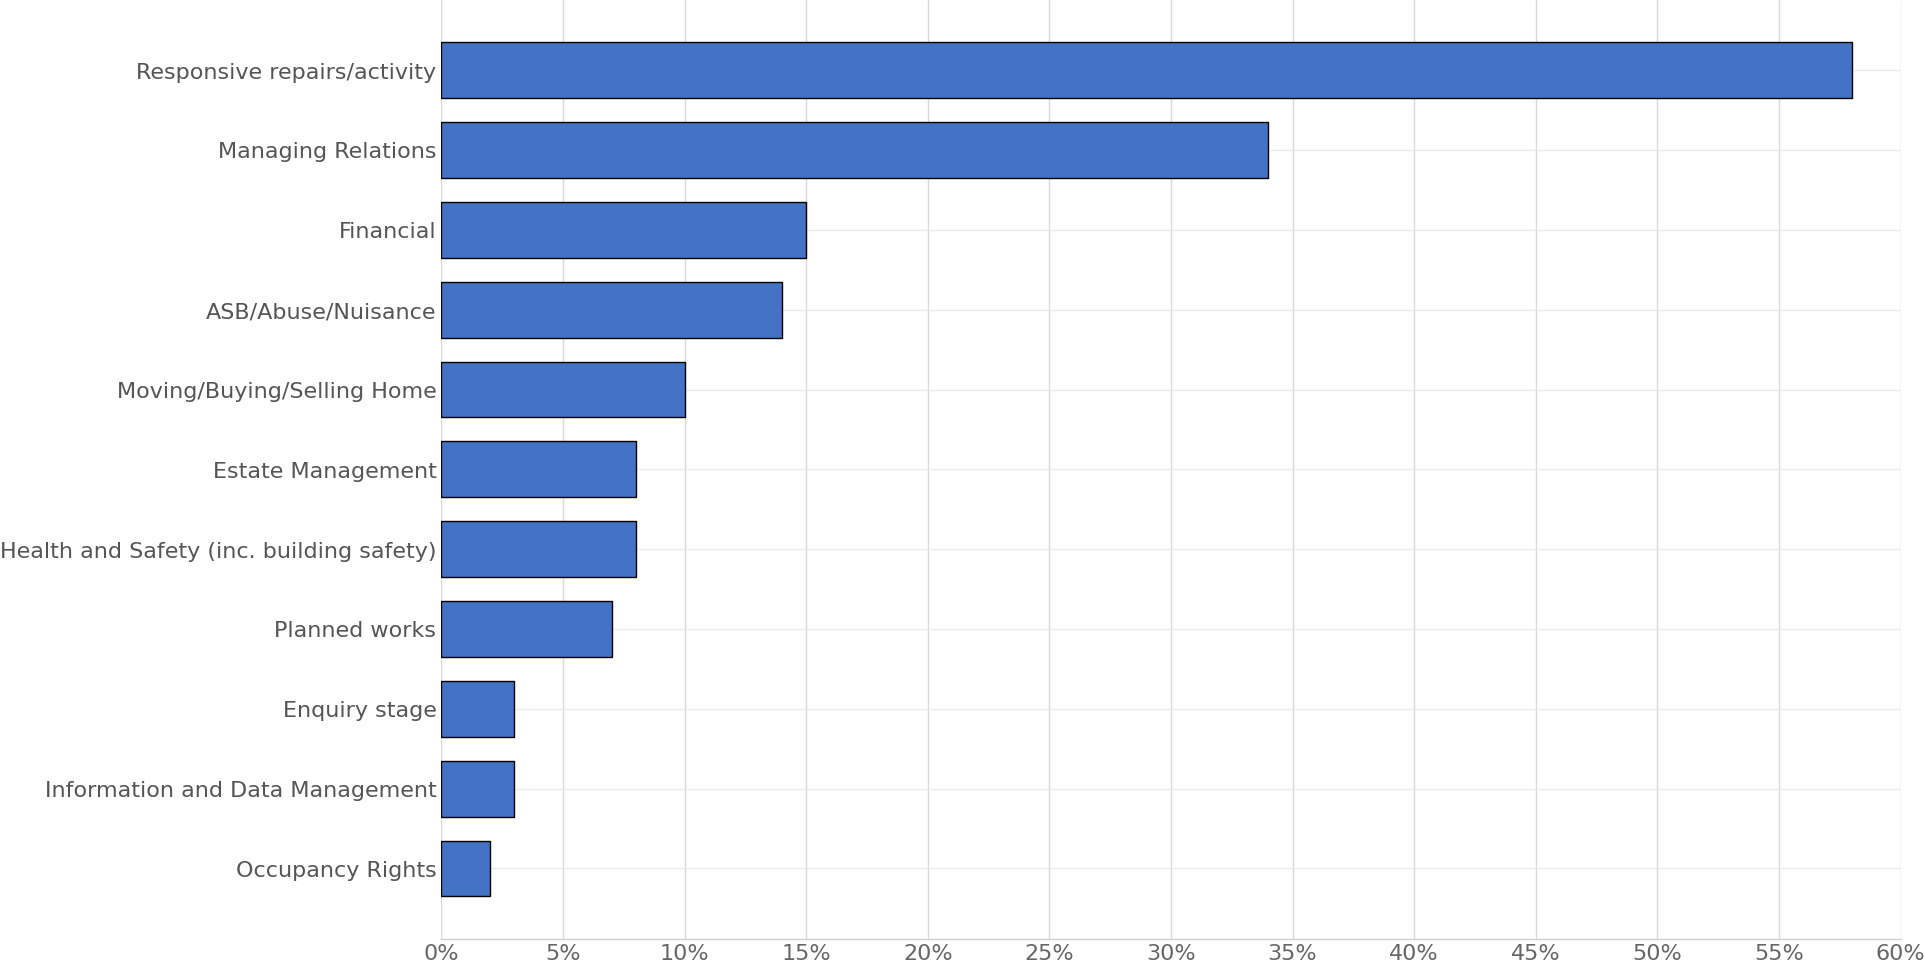
The complaint categories graph shows that ‘responsive repairs/activity’ was once again the most complained about category, with 58% of all complaints. That compares to the second highest ‘managing relations’, at 34%.

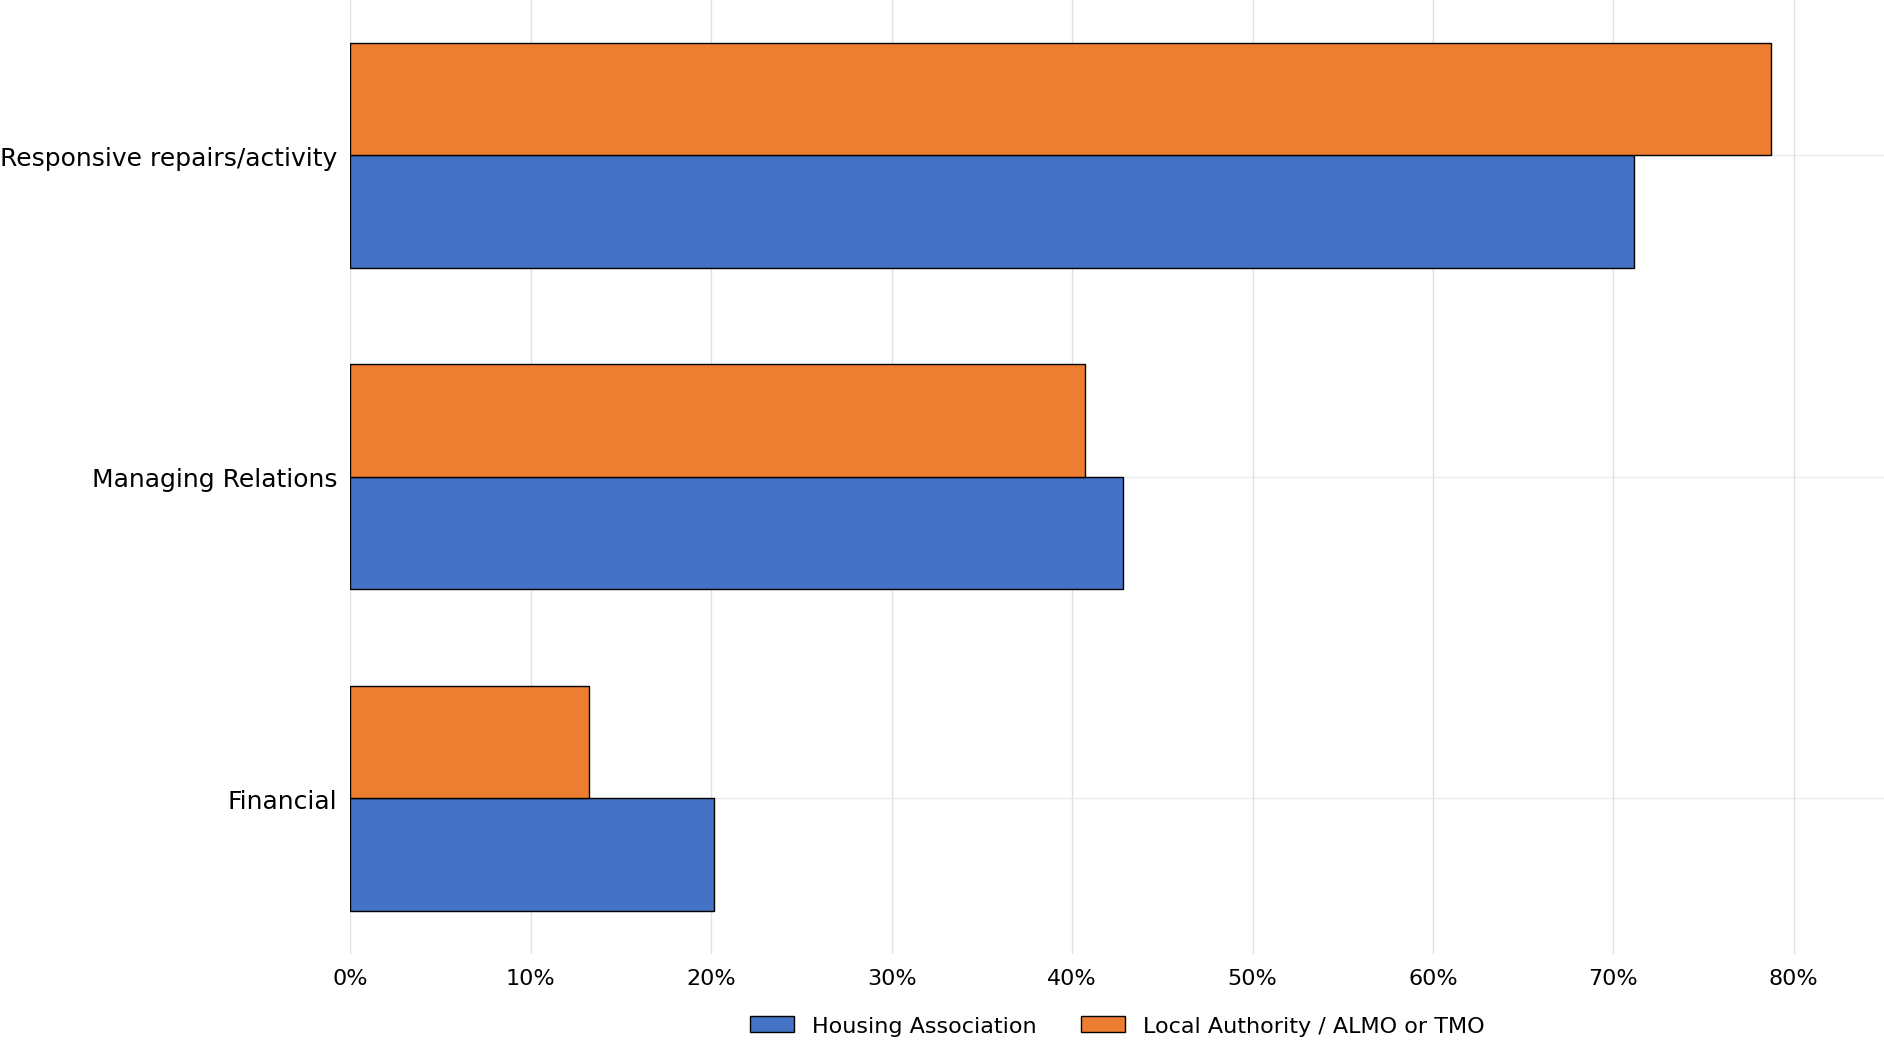
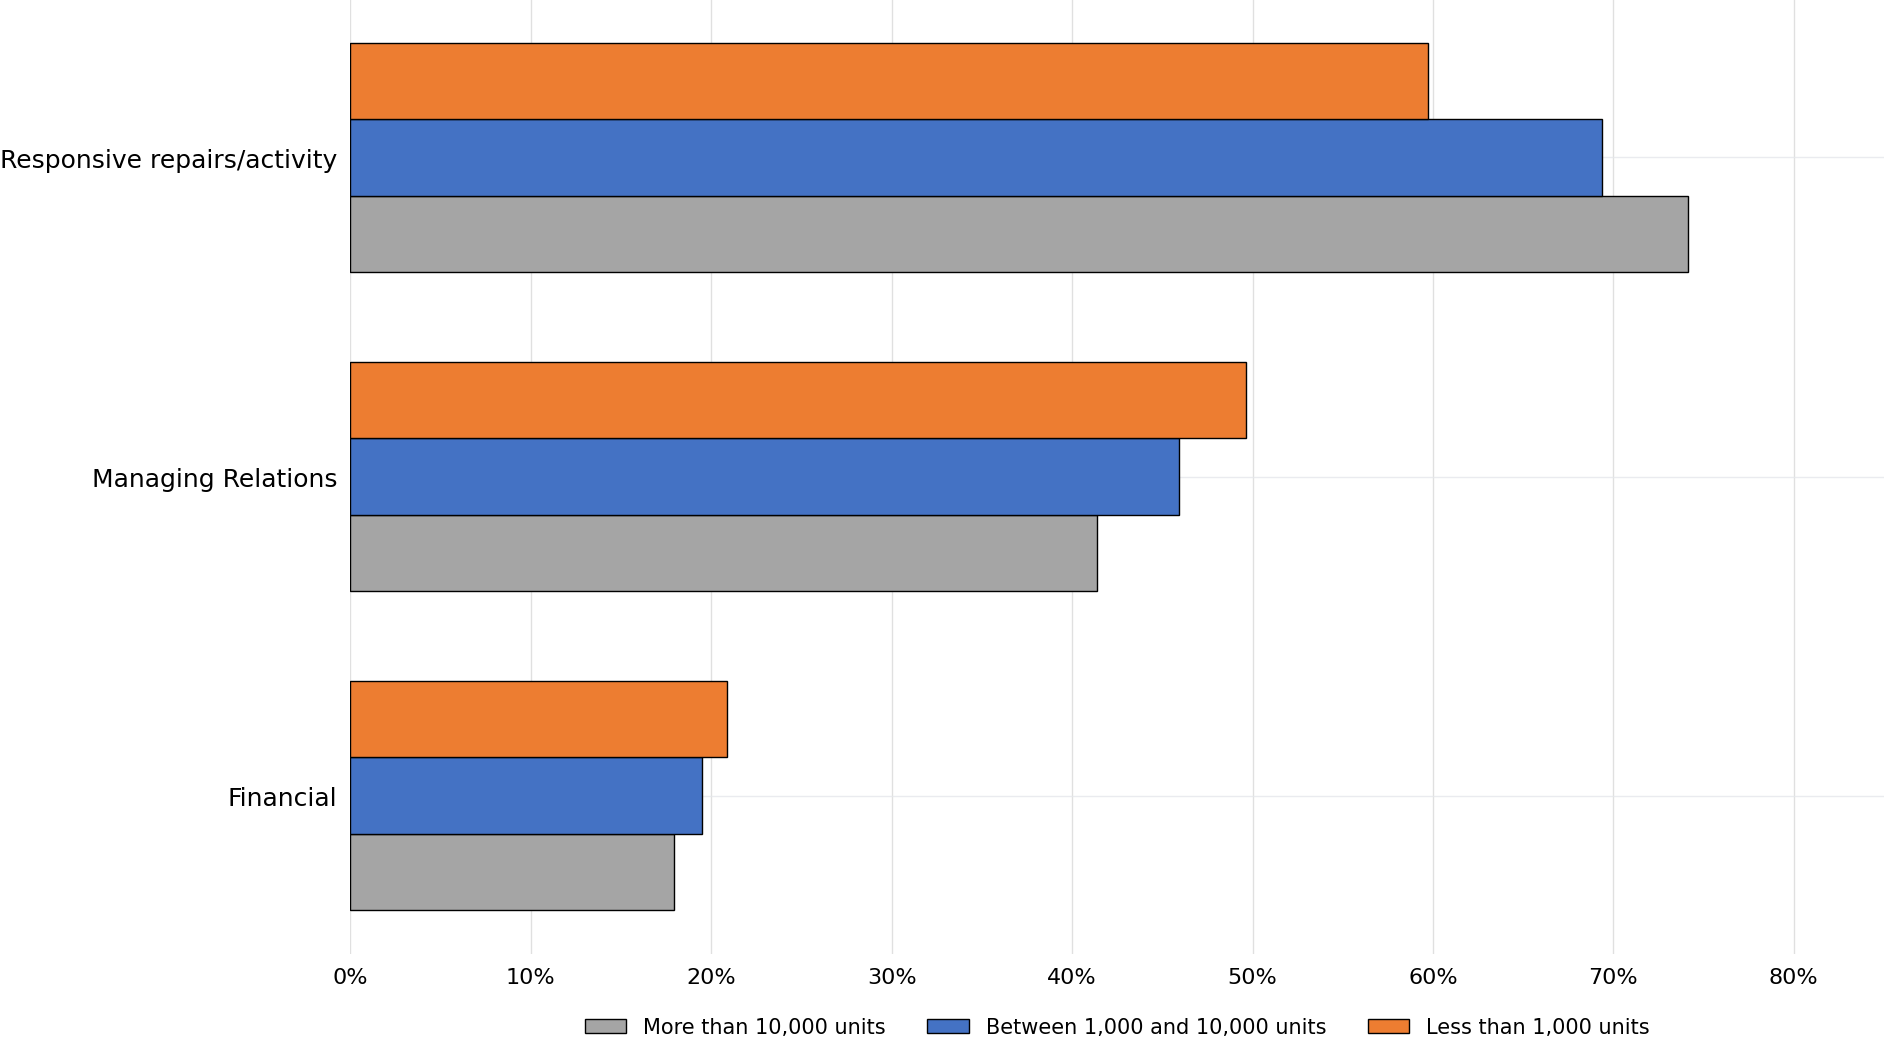
The following 2 graphs show how many complaints we receive from different types of landlords and different sizes regarding the top 3 complaint categories (responsive repairs/activity, managing relations, and financial).

From April 2025, we have updated the terminology of some of our complaint categories.

Property condition is now referred to as ‘responsive repairs/activity’.

Complaint handling is now referred to as ‘managing relations’.

Complaint categoriesHorizontal bar chart showing the percentage of complaints by category. Responsive repairs/activity accounts for 55% of complaints, followed by Managing Relations at 35%. Financial complaints make up 16.5% and ASB/Abuse/Nuisance 15%. Moving/Buying/Selling Home accounts for 10.3%, Estate Management 9.6%, Health and Safety (including building safety) 7.5%, and Planned works 7.2%. Smaller categories include Occupancy Rights at 3.0%, Information and Data Management at 2.3%, and Enquiry stage at 2.2%. Responsive repairs/activity is the largest complaint category by a clear margin.
Type of landlord

Horizontal grouped bar chart comparing the top three complaint categories by landlord type. For Responsive repairs/activity, Housing Associations account for 68% of complaints and Local Authorities, ALMOs and TMOs account for 73%. For Managing Relations, the figures are 44% and 45% respectively. For Financial complaints, the figures are 23% for Housing Associations and 17% for Local Authorities, ALMOs and TMOs. Responsive repairs/activity is the largest complaint category for both landlord types, while Financial complaints make up the smallest share of the three categories shown.

Size of landlord

Horizontal grouped bar chart comparing the top three complaint categories by landlord size. For Responsive repairs/activity, complaints account for 74% of cases for landlords with more than 10,000 units, 69% for landlords with between 1,000 and 10,000 units, and 60% for landlords with fewer than 1,000 units. For Managing Relations, the figures are 41%, 46%, and 50% respectively. For Financial complaints, the figures are 18%, 20%, and 21% respectively. Responsive repairs/activity is the largest complaint category across all landlord sizes, while Managing Relations makes up a larger share of complaints among smaller landlords.

Determinations

This graph shows how we found maladministration (whether that be severe, partial, or maladministration) in 70% of cases in the quarter

% of determinations
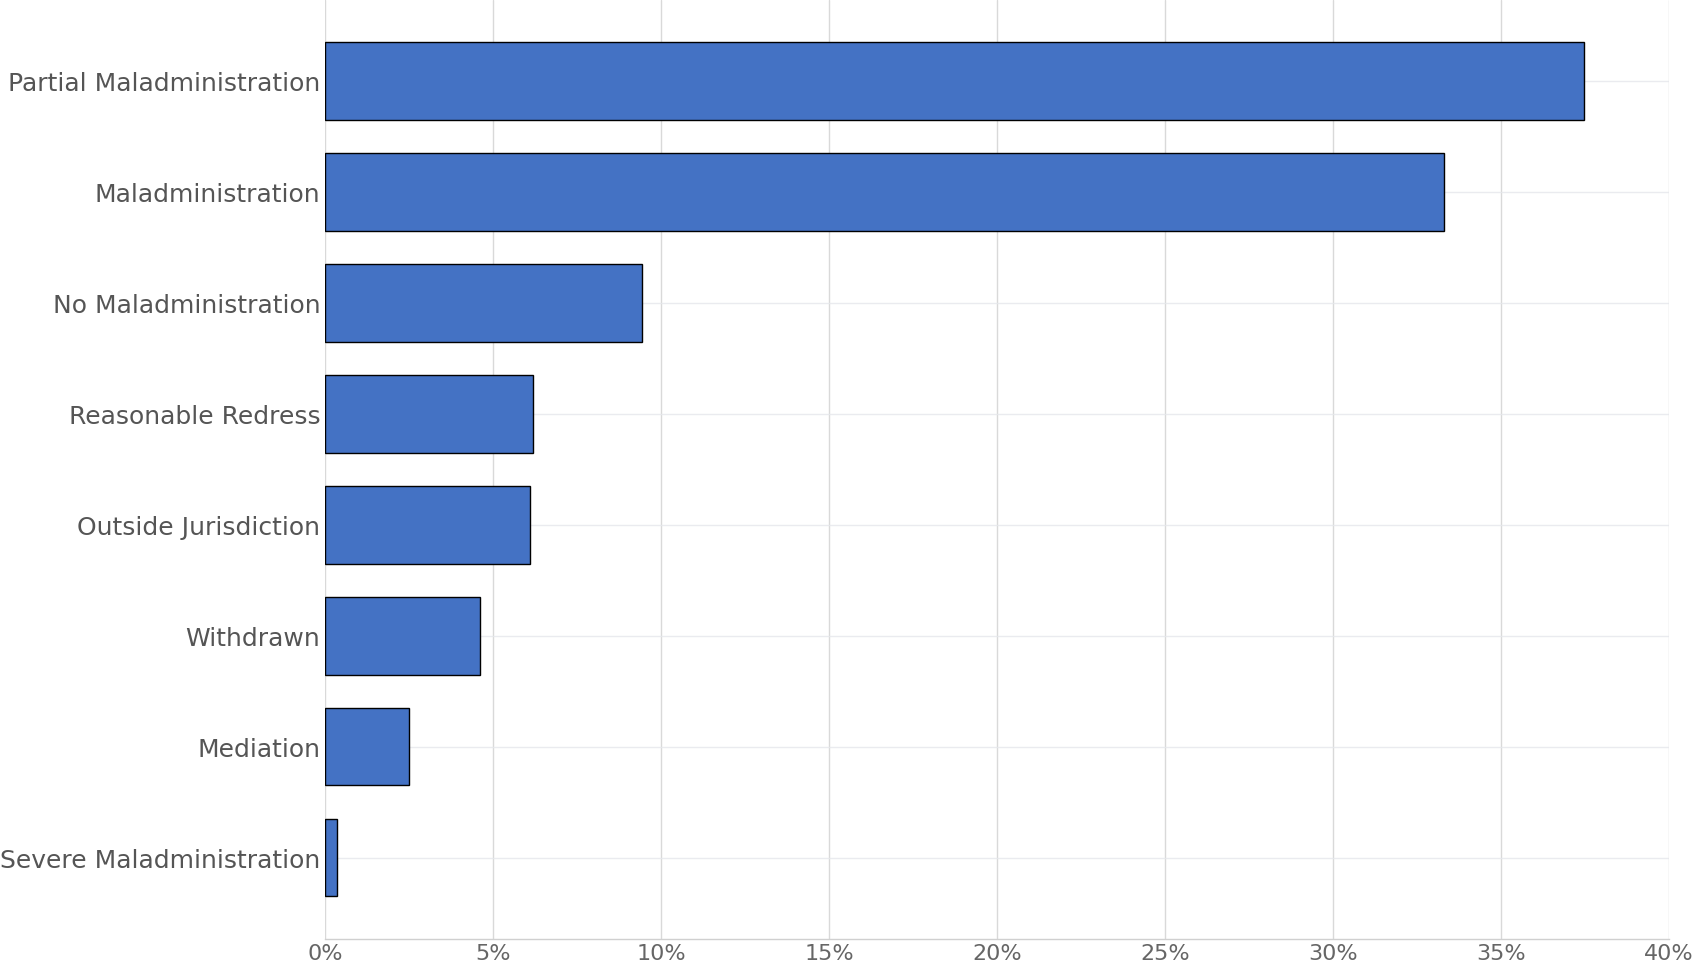
Horizontal bar chart showing the percentage of determinations by outcome. Partial maladministration is the most common outcome at 37.4%, followed by maladministration at 33.3%. No maladministration accounts for 9.5% of determinations. Reasonable redress accounts for 6.3%, outside jurisdiction 6.2%, and withdrawn 4.7%. Smaller categories include mediation at 2.5% and severe maladministration at 0.4%. Partial maladministration and maladministration together account for over 70% of all determinations.

Category findings

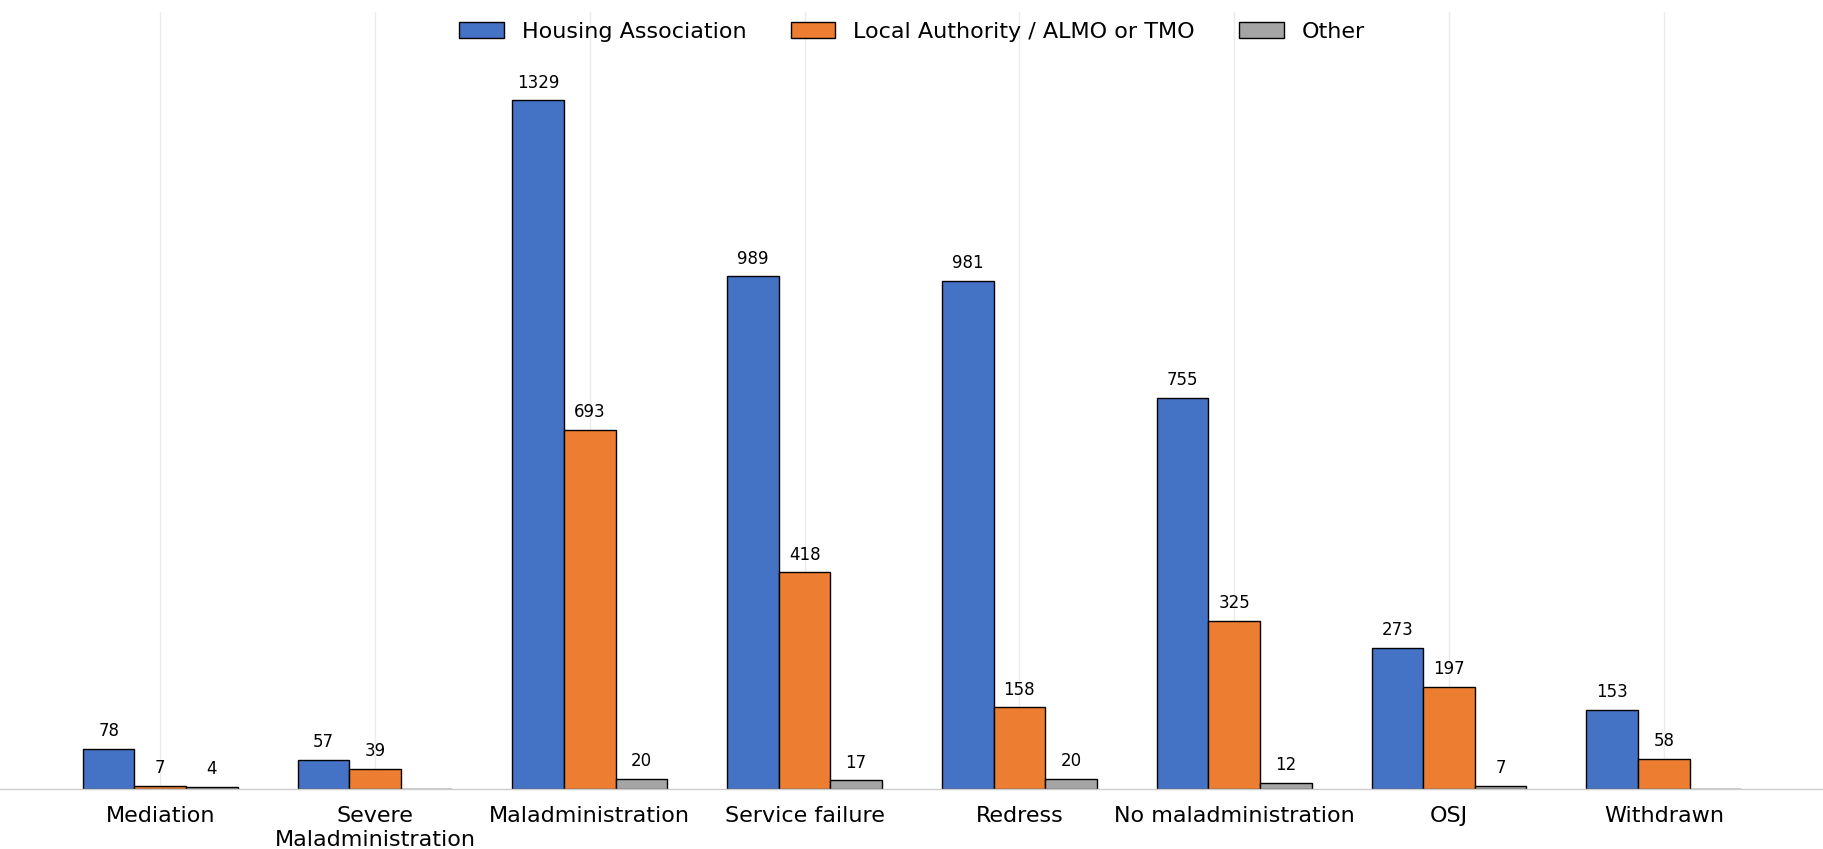
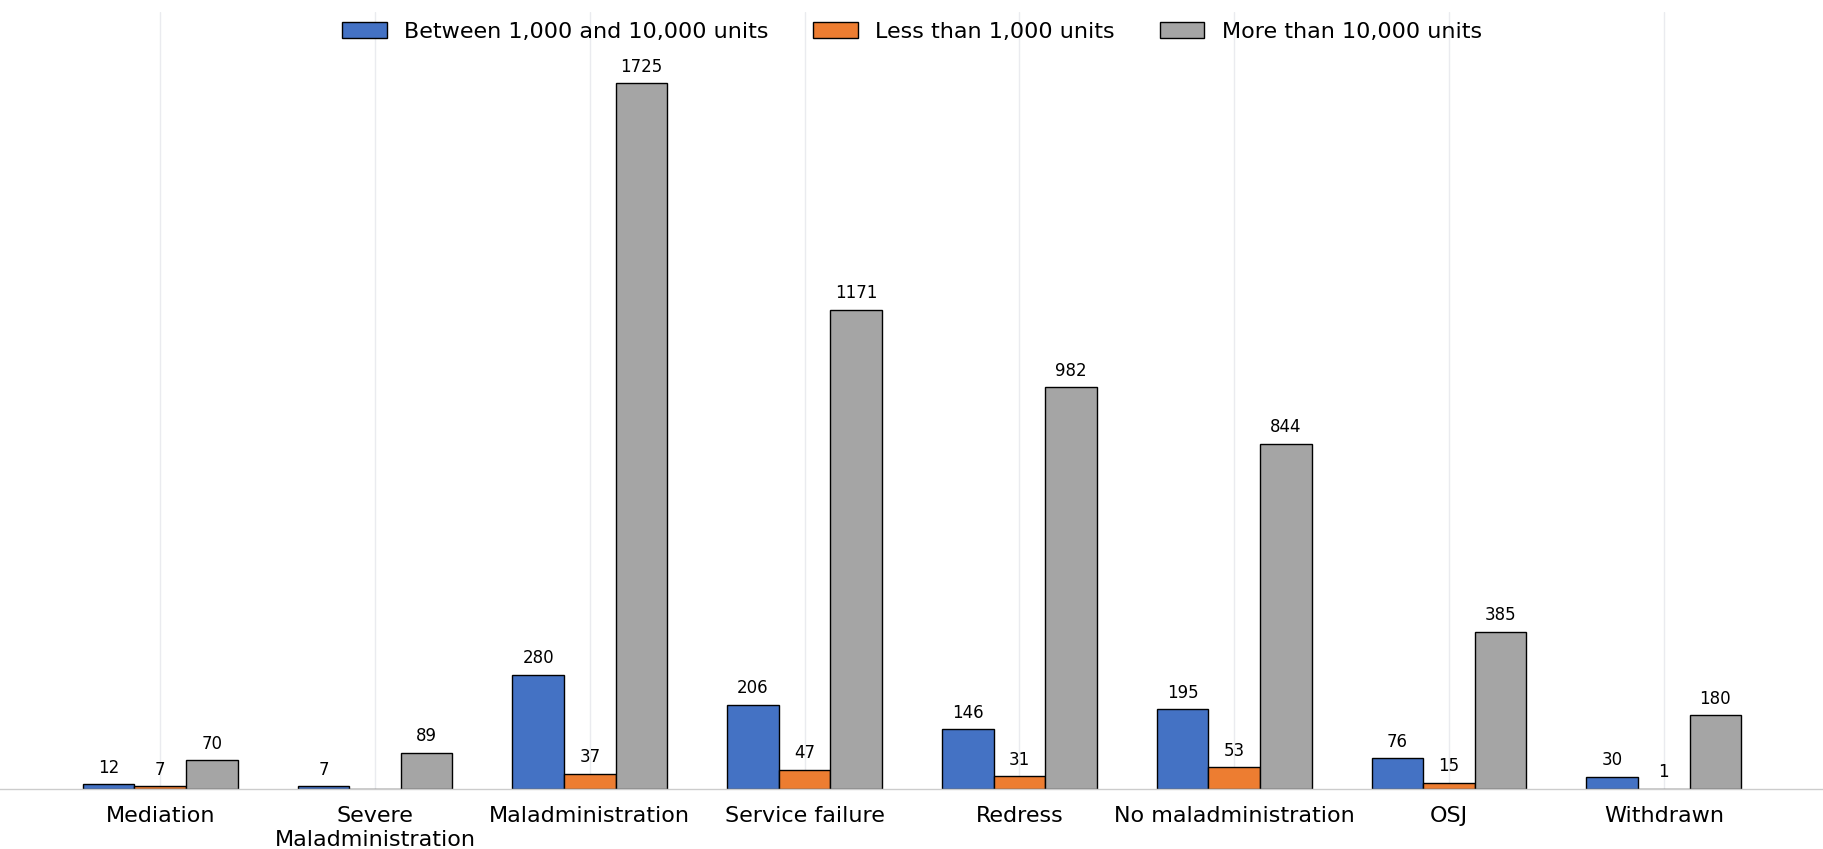
These graphs show how the different category findings relate to the top 3 complaint categories, the different types of landlords, and the different size of landlords.

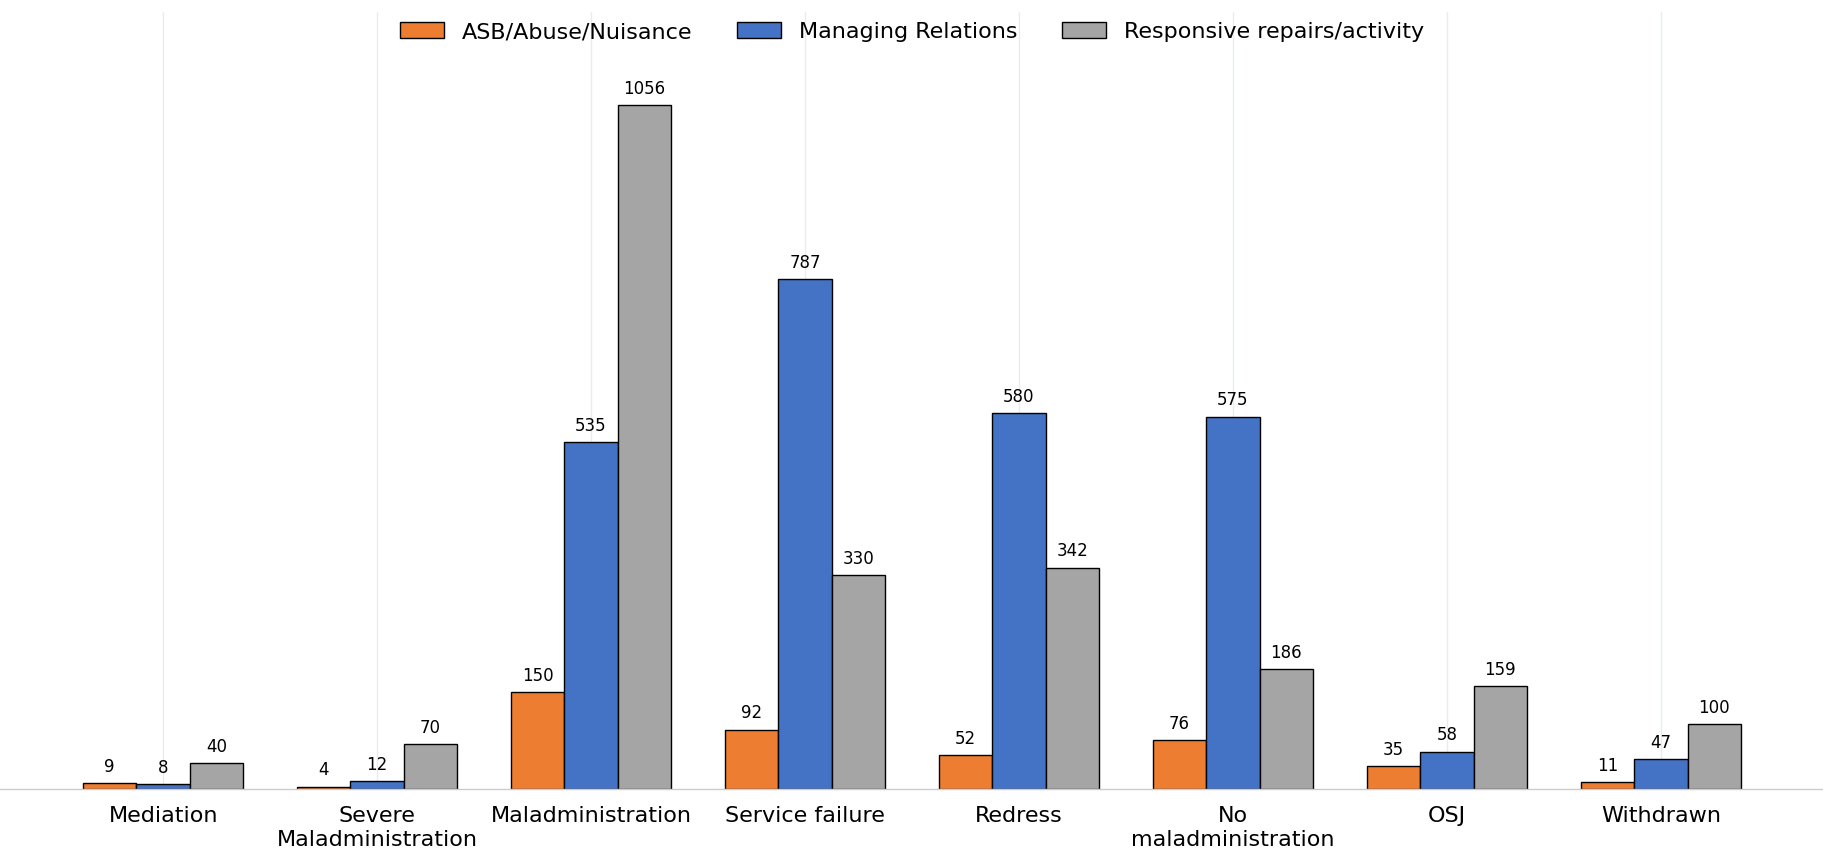
Different category findingsGrouped bar chart showing determination outcomes for the three most common complaint categories: ASB/Abuse/Nuisance, Managing Relations, and Responsive repairs/activity. For Mediation, there were 9, 8, and 40 cases respectively. For Severe maladministration, there were 4, 12, and 70 cases. Maladministration was the most common outcome for ASB/Abuse/Nuisance and Responsive repairs/activity, with 150 and 1,056 cases respectively, while Managing Relations had 535 maladministration cases. Service failure was the most common outcome for Managing Relations with 787 cases, compared with 92 ASB/Abuse/Nuisance cases and 330 Responsive repairs/activity cases. Redress accounted for 52, 580, and 342 cases respectively. No maladministration accounted for 76, 575, and 186 cases. Outside jurisdiction (OSJ) accounted for 35, 58, and 159 cases, while Withdrawn accounted for 11, 47, and 100 cases. Responsive repairs/activity had the highest number of maladministration findings, while Managing Relations had the highest numbers of service failure, redress and no maladministration outcomes.
Type of landlord

Grouped bar chart showing determination outcomes by landlord type: Housing Association, Local Authority, ALMO or TMO, and Other. For Mediation, there were 78, 7, and 4 cases respectively. For Severe maladministration, there were 57, 39, and 0 cases. Maladministration was the most common outcome across all landlord types, with 1,329 cases for Housing Associations, 693 for Local Authorities, ALMOs and TMOs, and 20 for Other landlords. Service failure accounted for 989, 418, and 17 cases respectively. Redress accounted for 981, 158, and 20 cases. No maladministration accounted for 755, 325, and 12 cases. Outside jurisdiction (OSJ) accounted for 273, 197, and 7 cases, while Withdrawn accounted for 153, 58, and 0 cases. Housing Associations had the highest number of cases across all determination outcomes.

Size of landlord

Grouped bar chart showing determination outcomes by landlord size: between 1,000 and 10,000 units, fewer than 1,000 units, and more than 10,000 units. For Mediation, there were 12, 7, and 70 cases respectively. For Severe maladministration, there were 7, 0, and 89 cases. Maladministration was the most common outcome, with 280 cases for landlords with 1,000 to 10,000 units, 37 for landlords with fewer than 1,000 units, and 1,725 for landlords with more than 10,000 units. Service failure accounted for 206, 47, and 1,171 cases respectively. Redress accounted for 146, 31, and 982 cases. No maladministration accounted for 195, 53, and 844 cases. Outside jurisdiction (OSJ) accounted for 76, 15, and 385 cases, while Withdrawn accounted for 30, 1, and 180 cases. Landlords with more than 10,000 units recorded the highest number of determinations across all outcomes.

Orders and recommendations

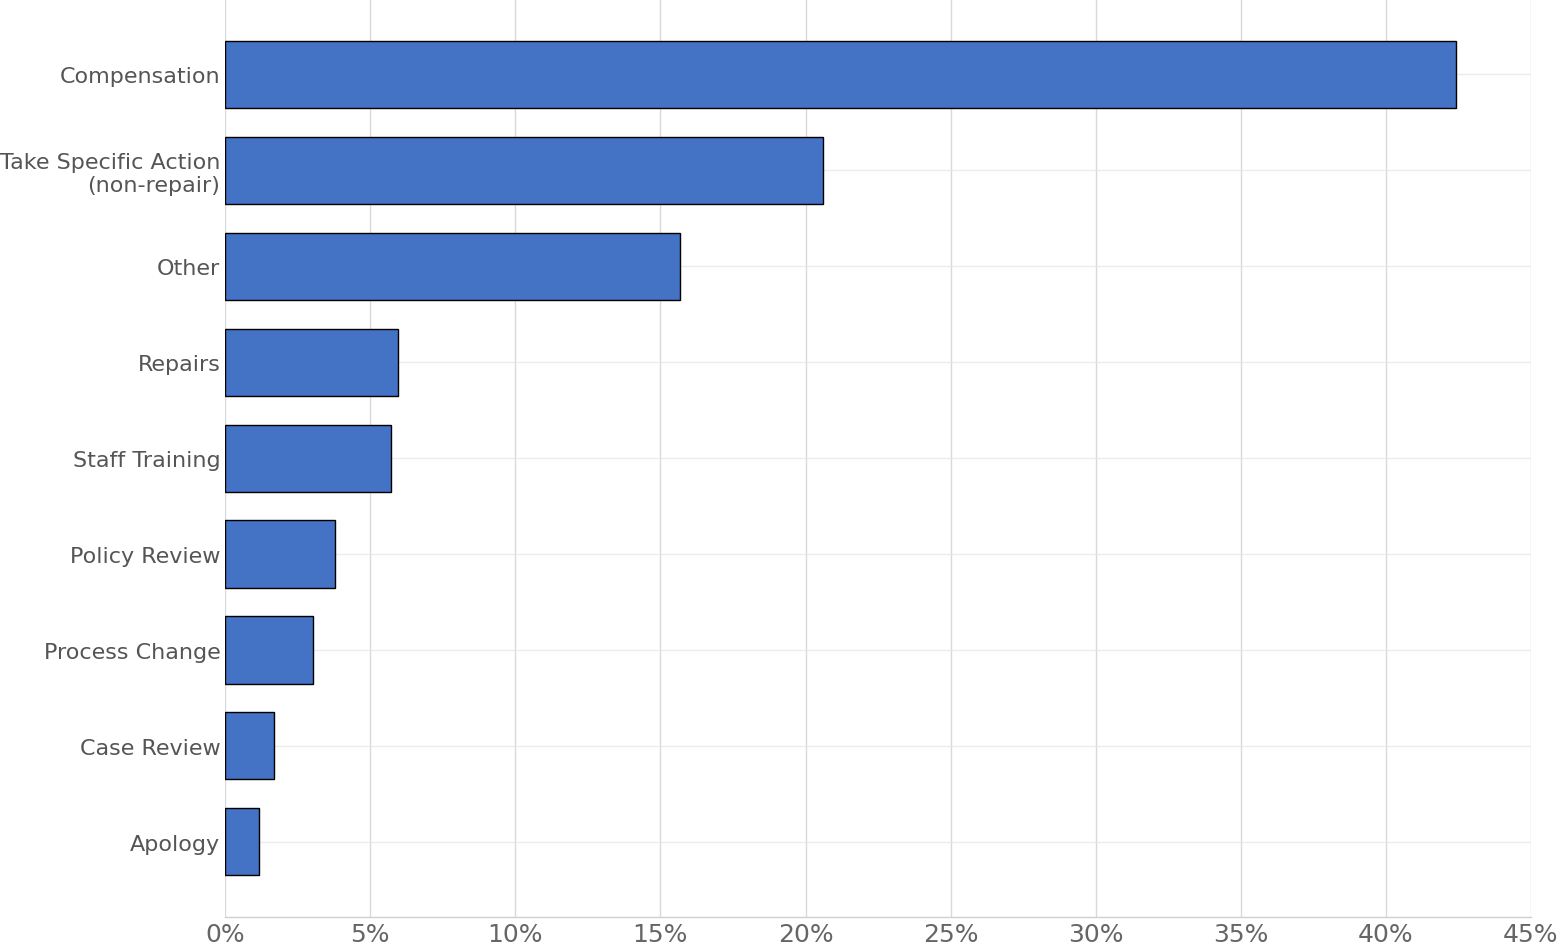
The orders given to landlords graph shows that in 48% of cases, we ordered landlords to pay residents compensation. And the recommendations given to landlord’s graph shows that in 21% of cases, we recommended that the landlord take non-specific action (usually something that is outside a repair).

The final graph shows how many orders and recommendations we’ve made based on the top 3 complaint categories.

Orders given to landlords
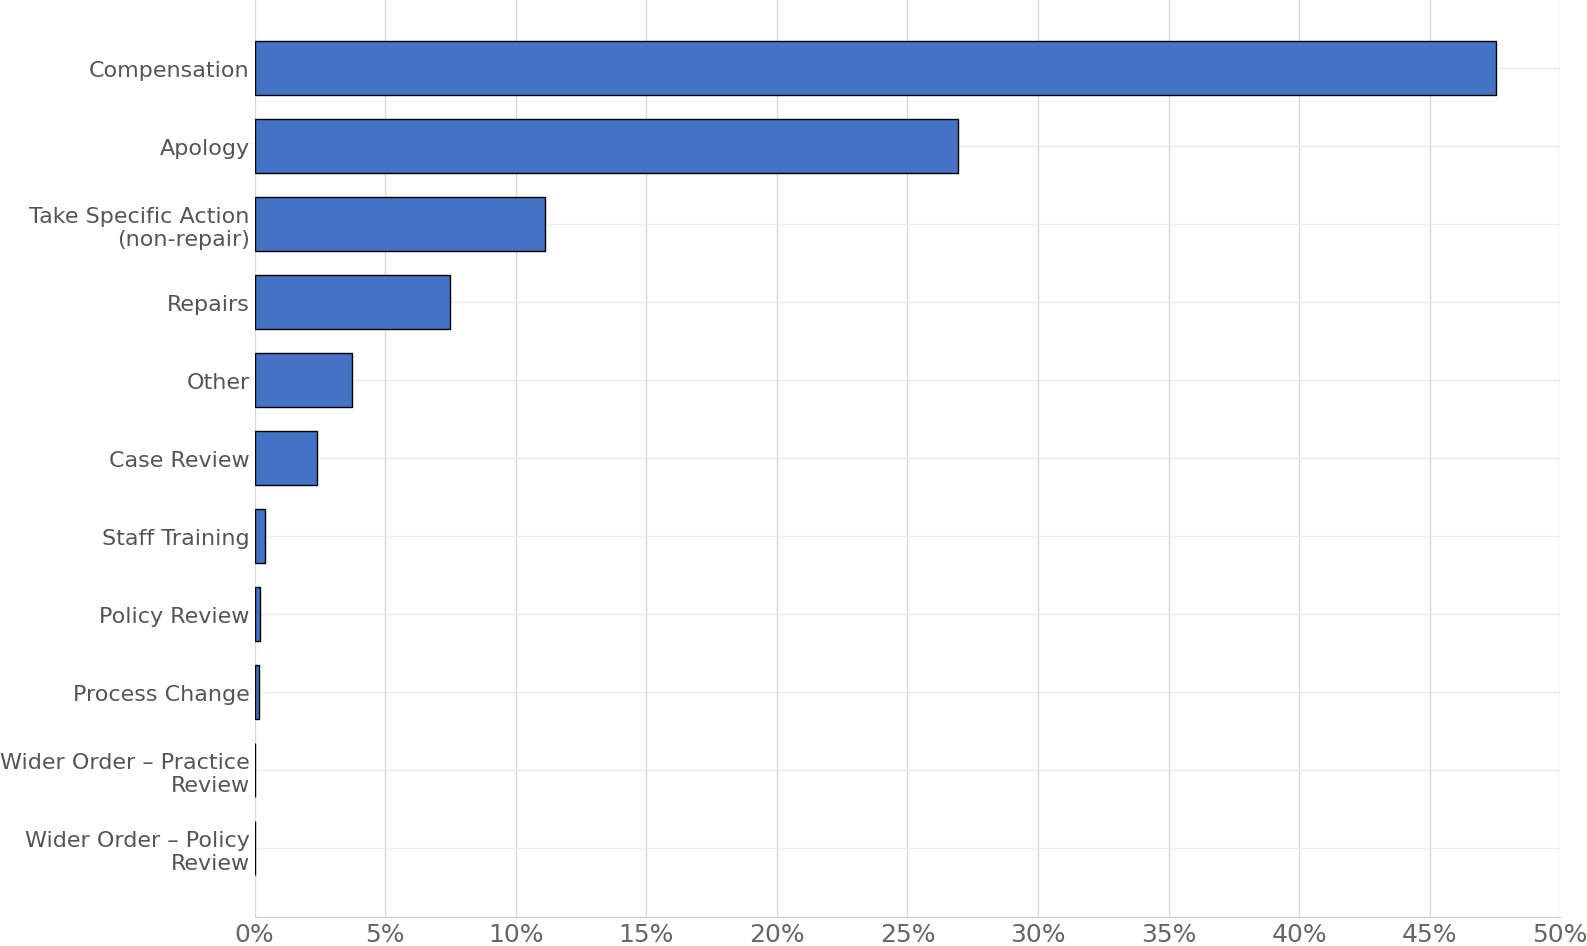
Horizontal bar chart showing the percentage of orders made by order type. Compensation is the most common order, accounting for 47.6% of all orders, followed by Apology at 26.9%. Take Specific Action (non-repair) accounts for 11.1%, and Repairs account for 7.4%. Smaller categories include Other at 3.7%, Case Review at 2.3%, Staff Training at 0.4%, Policy Review at 0.2%, and Process Change at 0.2%. Wider Order – Practice Review and Wider Order – Policy Review each account for less than 0.1%. Compensation and apologies together make up nearly three-quarters of all orders.

Recommendations given to landlords

Horizontal bar chart showing the percentage of recommendations made by recommendation type. Compensation is the most common recommendation at 42.3%, followed by Take Specific Action (non-repair) at 20.5% and Other at 15.7%. Repairs account for 6.0% of recommendations and Staff Training for 5.8%. Smaller categories include Policy Review at 3.8%, Process Change at 3.1%, Case Review at 1.6%, and Apology at 1.1%. Compensation is the most frequently recommended action by a clear margin.

Orders and recommendations made against top 3 complaints
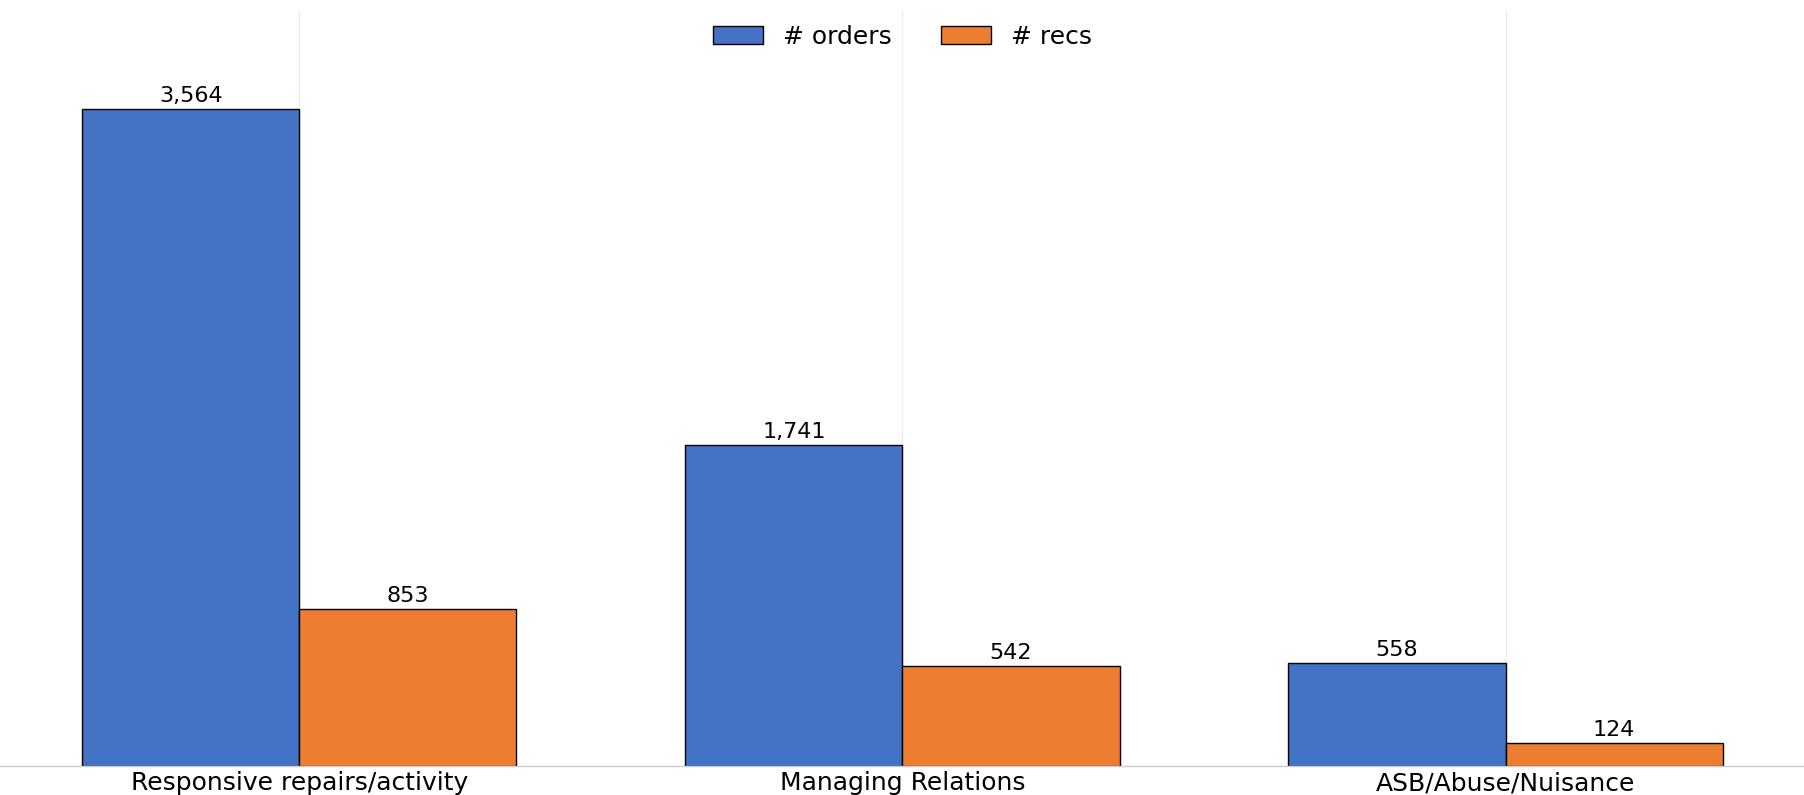
Grouped bar chart comparing the number of orders and recommendations for the three most common complaint categories. For Responsive repairs/activity, there were 3,564 orders and 853 recommendations. For Managing Relations, there were 1,741 orders and 542 recommendations. For ASB/Abuse/Nuisance, there were 558 orders and 124 recommendations. In all three categories, the number of orders is higher than the number of recommendations. Responsive repairs/activity had the highest number of both orders and recommendations, while ASB/Abuse/Nuisance had the lowest.