Q3 Quarterly Data 2025-26

In this quarter, from October to December 2025, we made 2,462 determinations.

This page refers to Complaint Handling Failure Orders (CHFOs), which was our process at the time of publication. We now issue Complaint Handling Failure Notices (CHFNs) in these circumstances. View the latest information on how we bring landlords into compliance in casework.

Complaints received

The complaint categories graph shows that ‘responsive repairs/activity’ was once again the most complained about category, with 55% of all complaints. That compares to the second highest ‘managing relations’, at 35%.

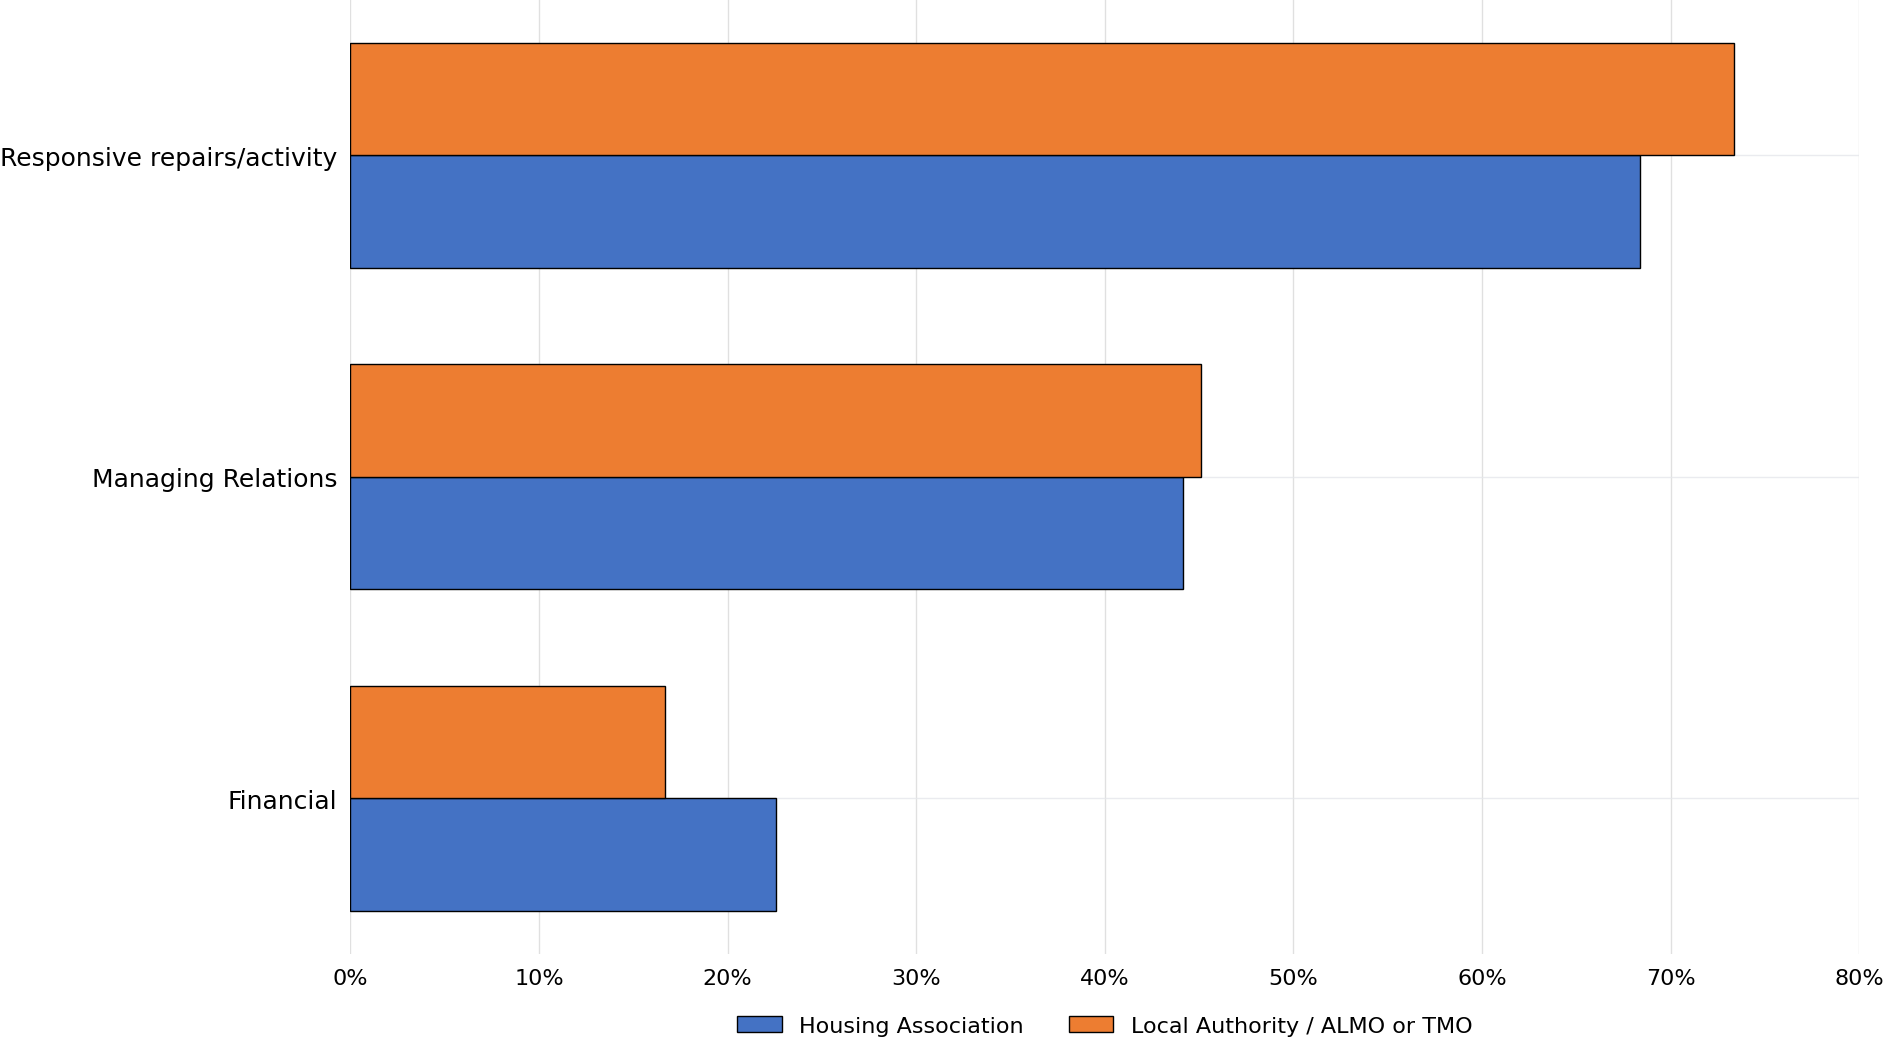
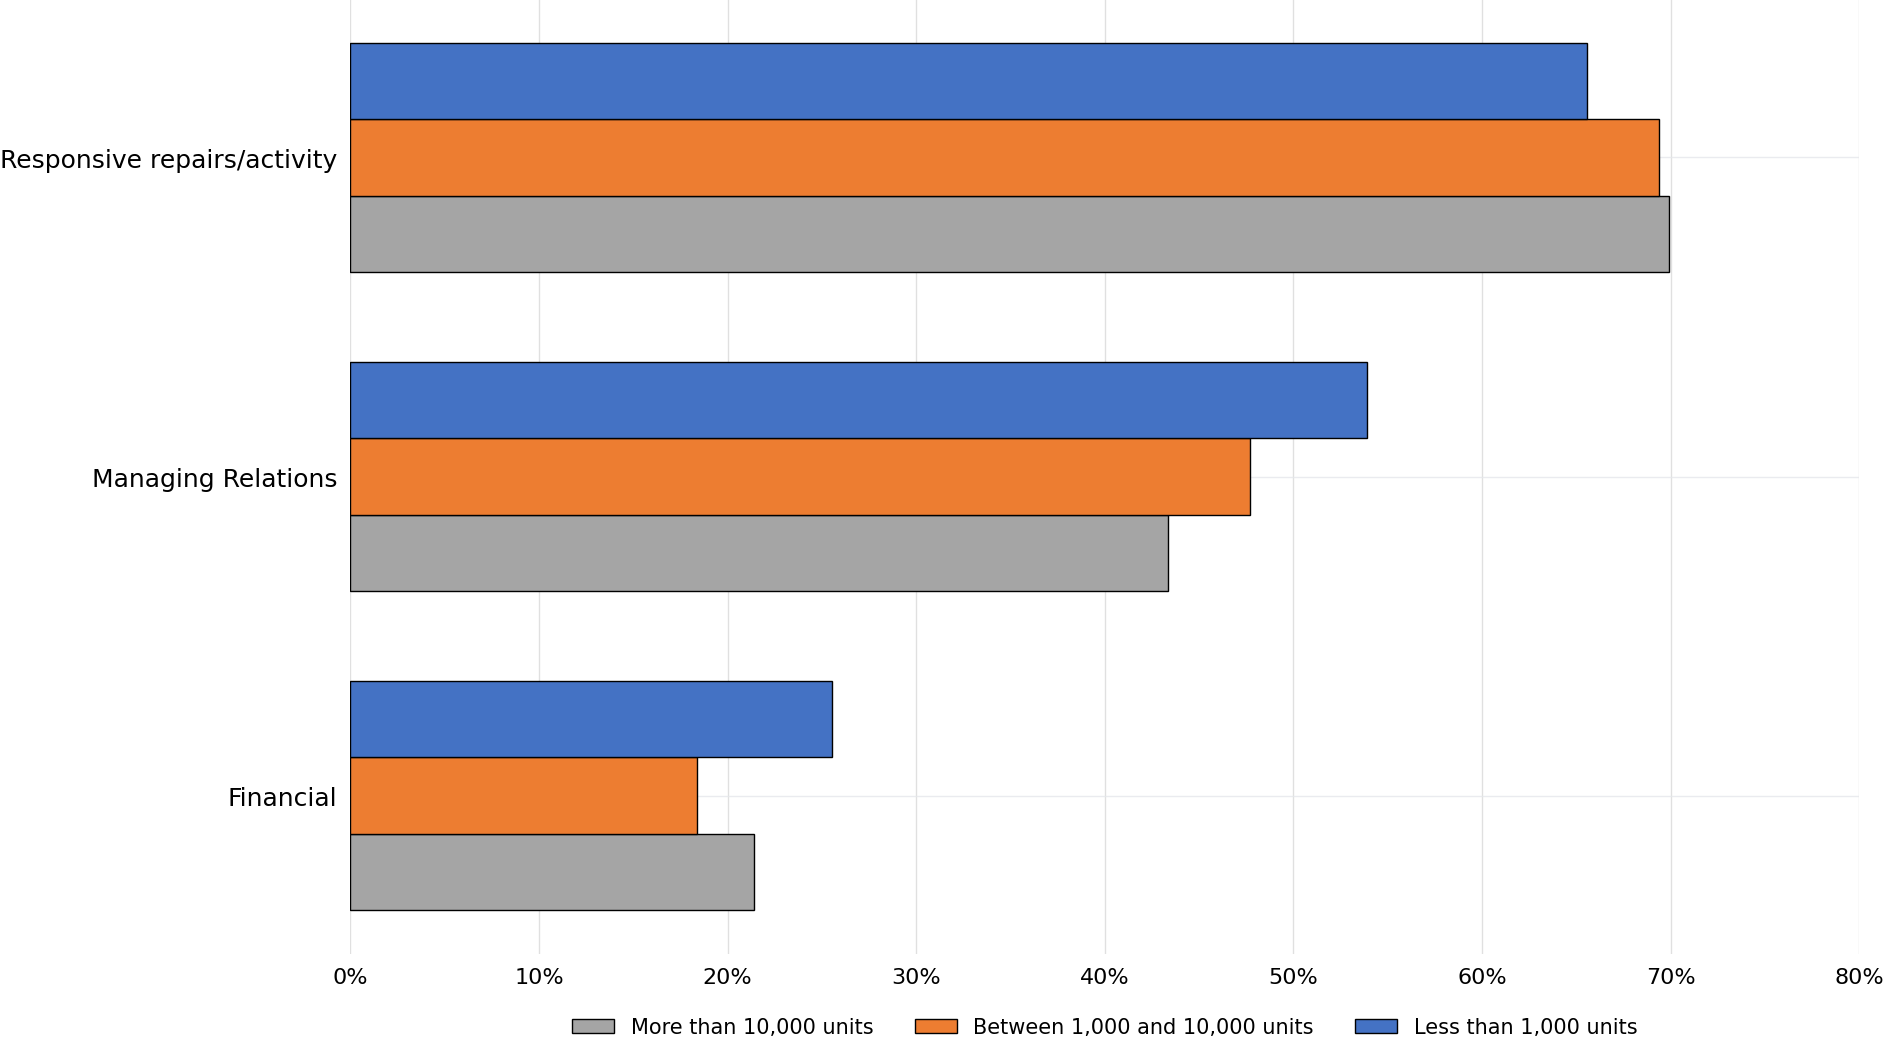
The following 2 graphs show how many complaints we receive from different types of landlords and different sizes regarding the top 3 complaint categories (responsive repairs/activity, managing relations, and financial).

From April 2025, we have updated the terminology of some of our complaint categories.

Property condition is now referred to as ‘responsive repairs/activity’.

Complaint handling is now referred to as ‘managing relations’.

Complaint categories
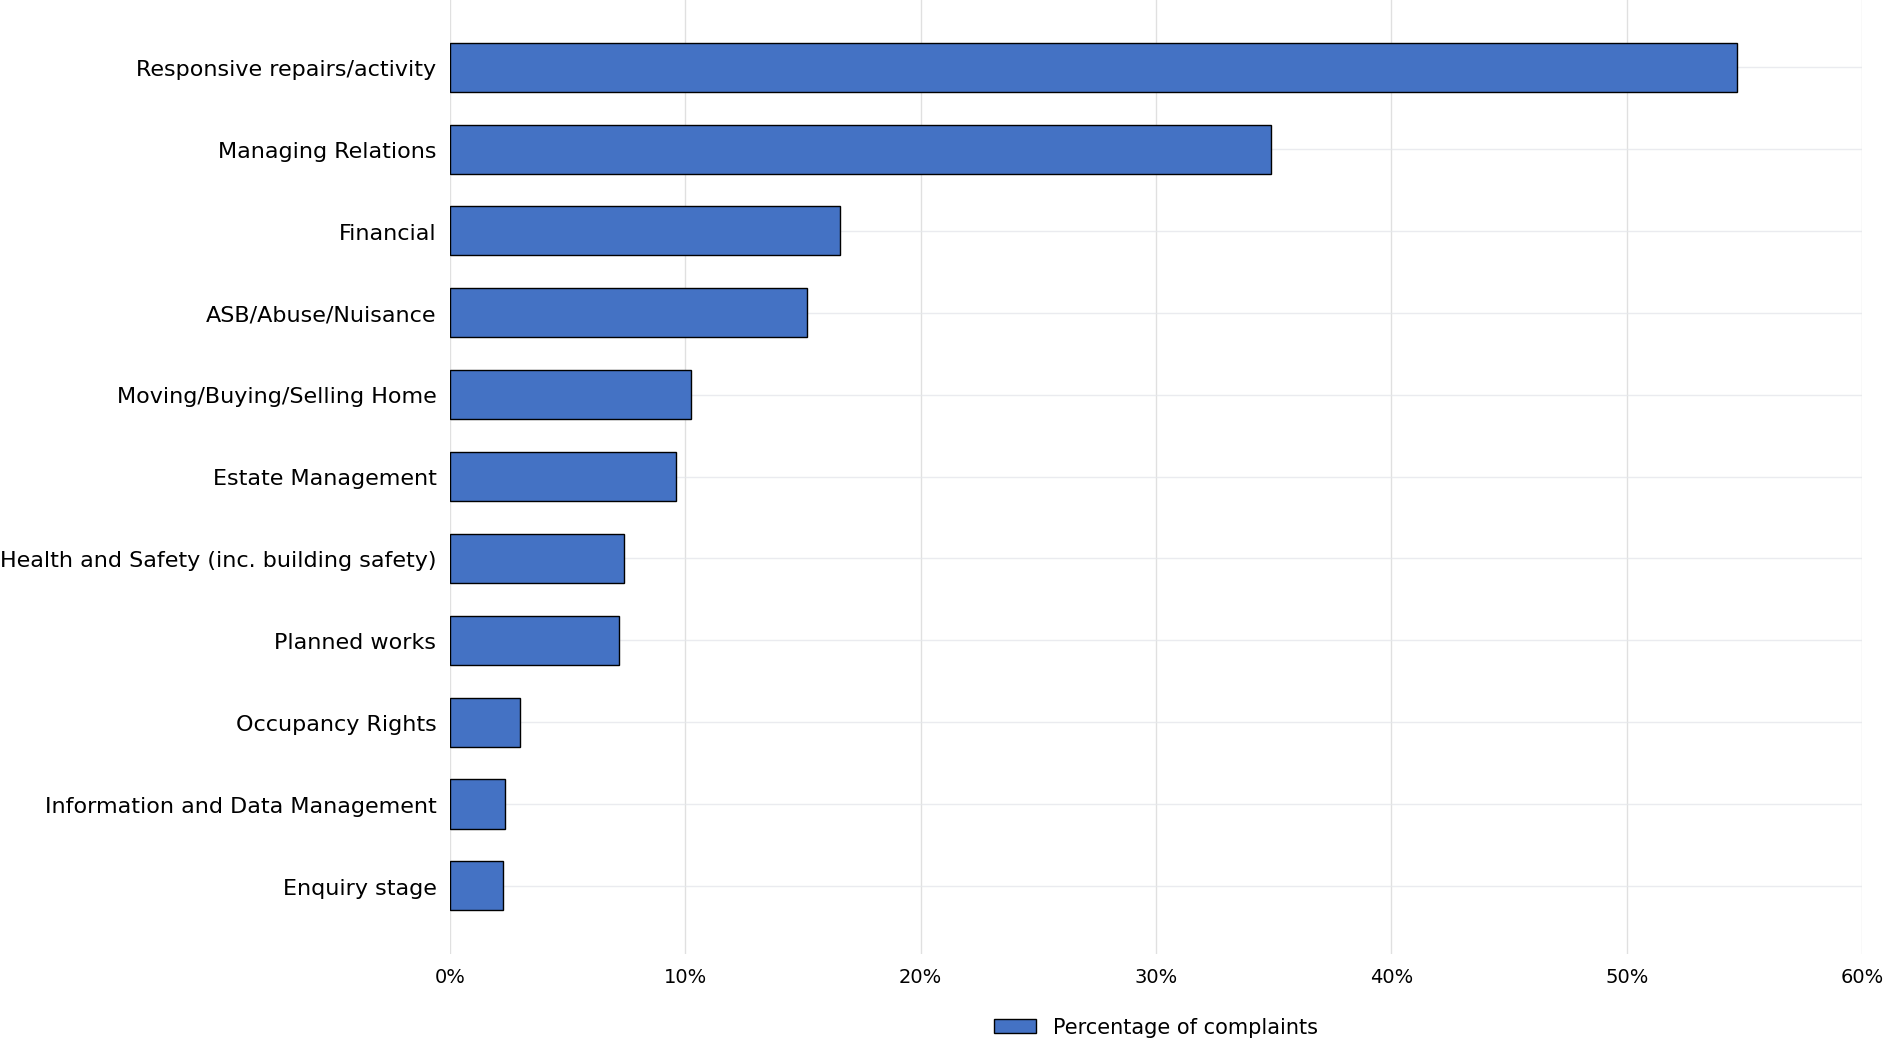
Horizontal bar chart showing the percentage of complaints by category. Responsive repairs/activity accounts for 55% of complaints, followed by Managing Relations at 35%. Financial complaints make up 16.5% and ASB/Abuse/Nuisance 15%. Moving/Buying/Selling Home accounts for 10.3%, Estate Management 9.6%, Health and Safety (including building safety) 7.5%, and Planned Works 7.2%. Smaller categories are Occupancy Rights at 3%, Information and Data Management at 2.3%, and Enquiry Stage at 2.2%. Responsive repairs/activity is the largest category by a clear margin.


Type of landlord

Horizontal grouped bar chart comparing complaint categories by landlord type. For Responsive repairs/activity, Housing Associations account for 68% of complaints and Local Authorities/ALMOs/TMOs account for 73%. For Managing Relations, Housing Associations account for 44% and Local Authorities/ALMOs/TMOs 45%. For Financial complaints, Housing Associations account for 23% and Local Authorities/ALMOs/TMOs 17%. Responsive repairs/activity is the largest complaint category for both landlord types.

Size of landlord

Horizontal grouped bar chart comparing complaint categories by landlord size. For Responsive repairs/activity, landlords with more than 10,000 units account for 70% of complaints, landlords with between 1,000 and 10,000 units account for 69%, and landlords with fewer than 1,000 units account for 66%. For Managing Relations, the figures are 43%, 48%, and 54% respectively. For Financial complaints, the figures are 21%, 18%, and 25% respectively. Responsive repairs/activity is the largest complaint category across all landlord sizes, while Managing Relations is highest among landlords with fewer than 1,000 units.

Determinations

This graph shows how we found maladministration (whether that be severe, partial, or maladministration) in 75% of cases in the quarter.

% of determinations
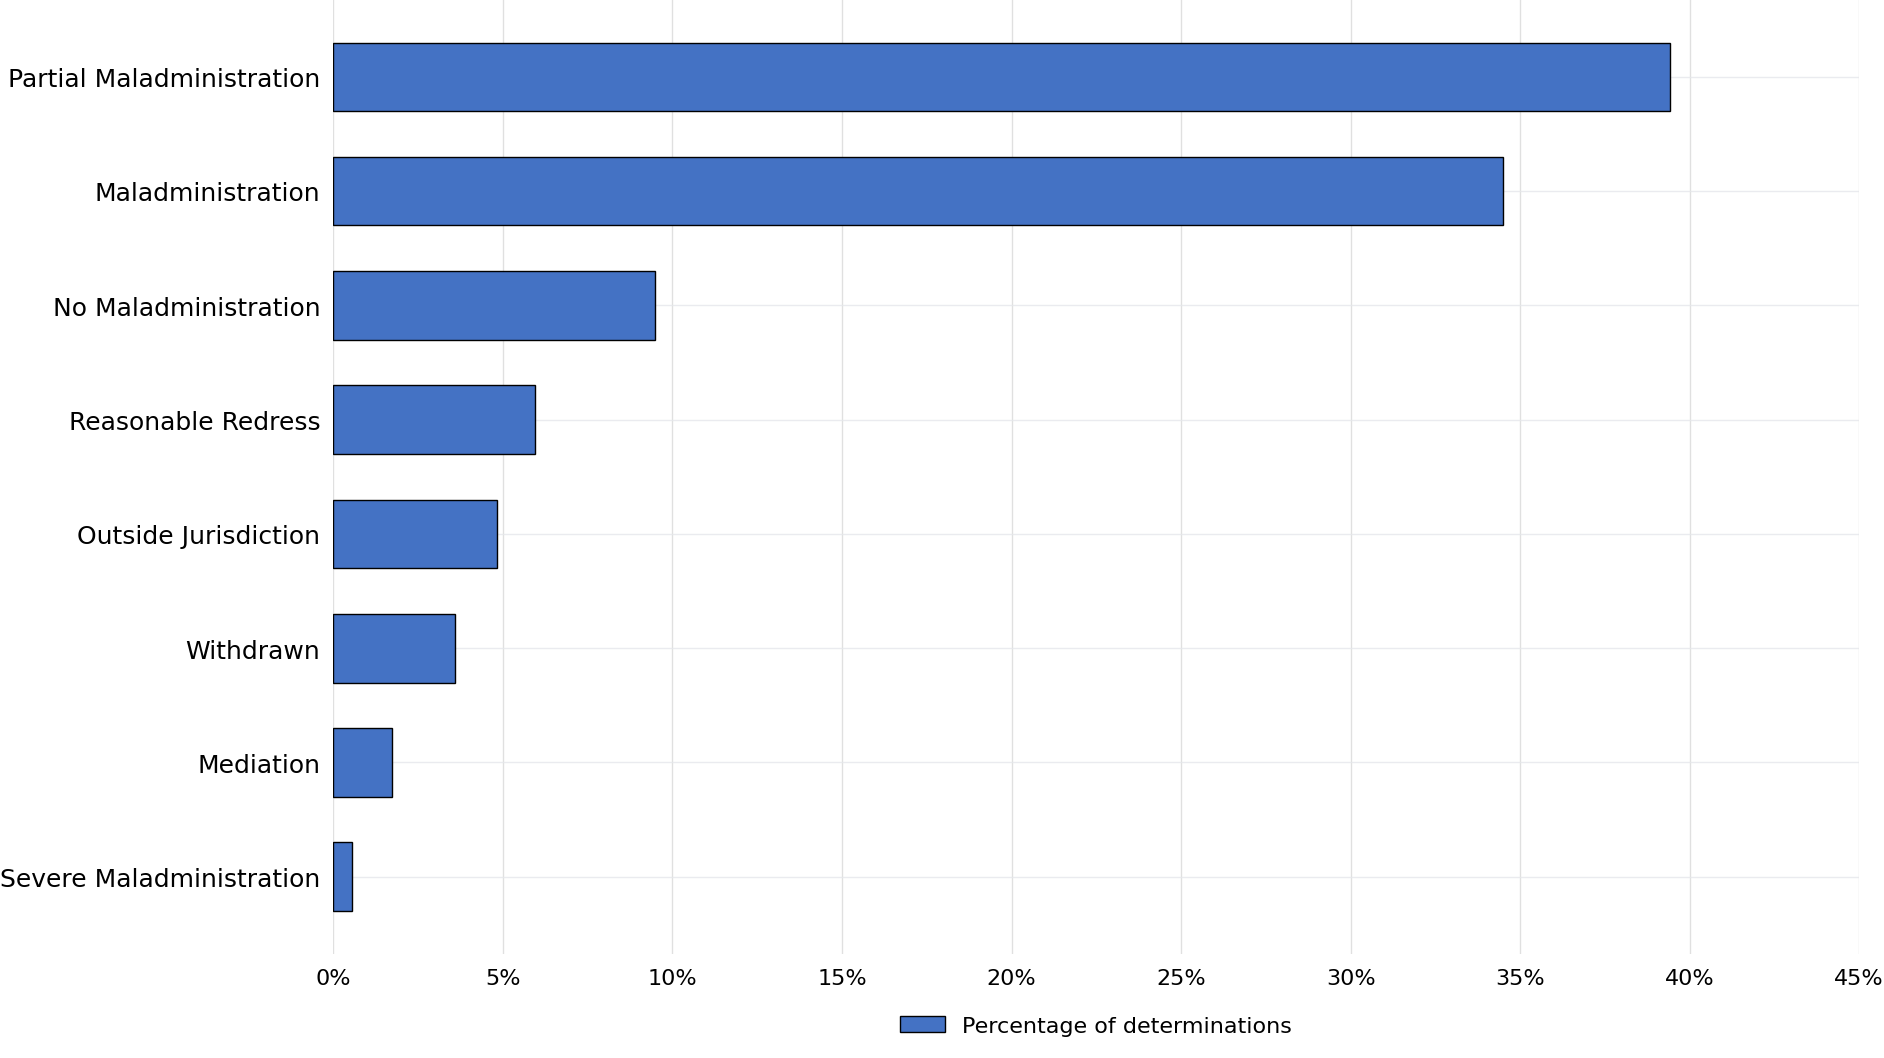
Horizontal bar chart showing the percentage of determinations by outcome. Partial maladministration is the most common outcome at 39%, followed by maladministration at 34.5%. No maladministration accounts for 9.5% of determinations. Reasonable redress accounts for 6%, outside jurisdiction 4.8%, and withdrawn 3.6%. Smaller categories are mediation at 1.7% and severe maladministration at 0.5%. Partial maladministration and maladministration together make up the majority of determinations.

Category findings

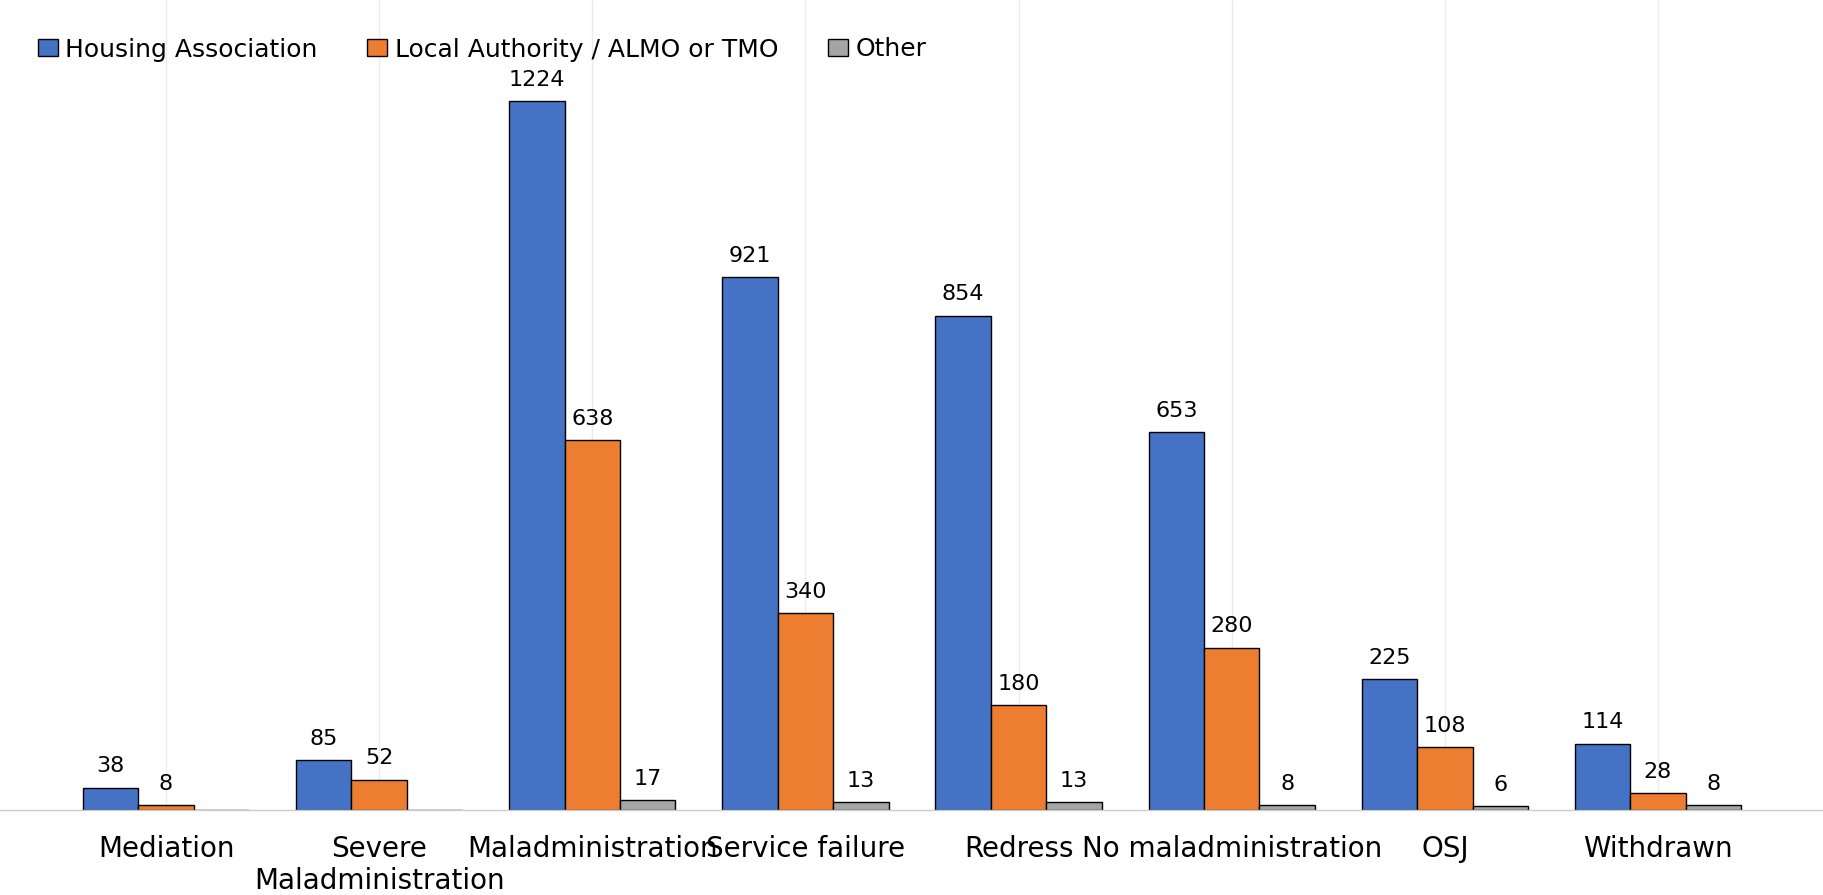
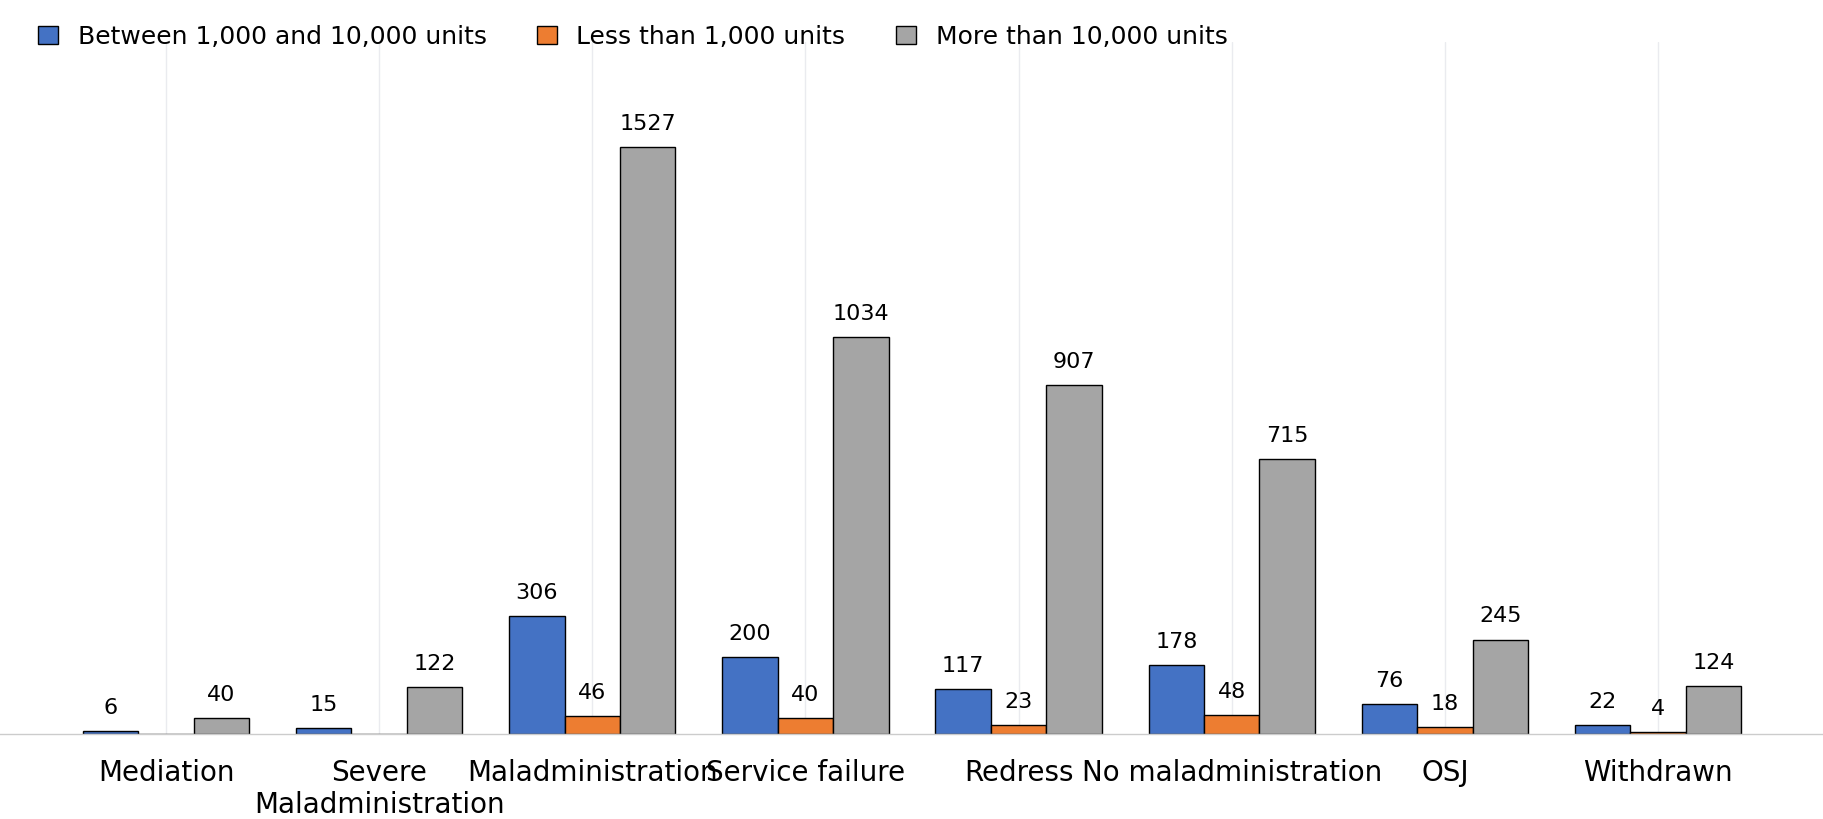
These graphs show how the different category findings relate to the top 3 complaint categories, the different types of landlords, and the different size of landlords.

Different category findings
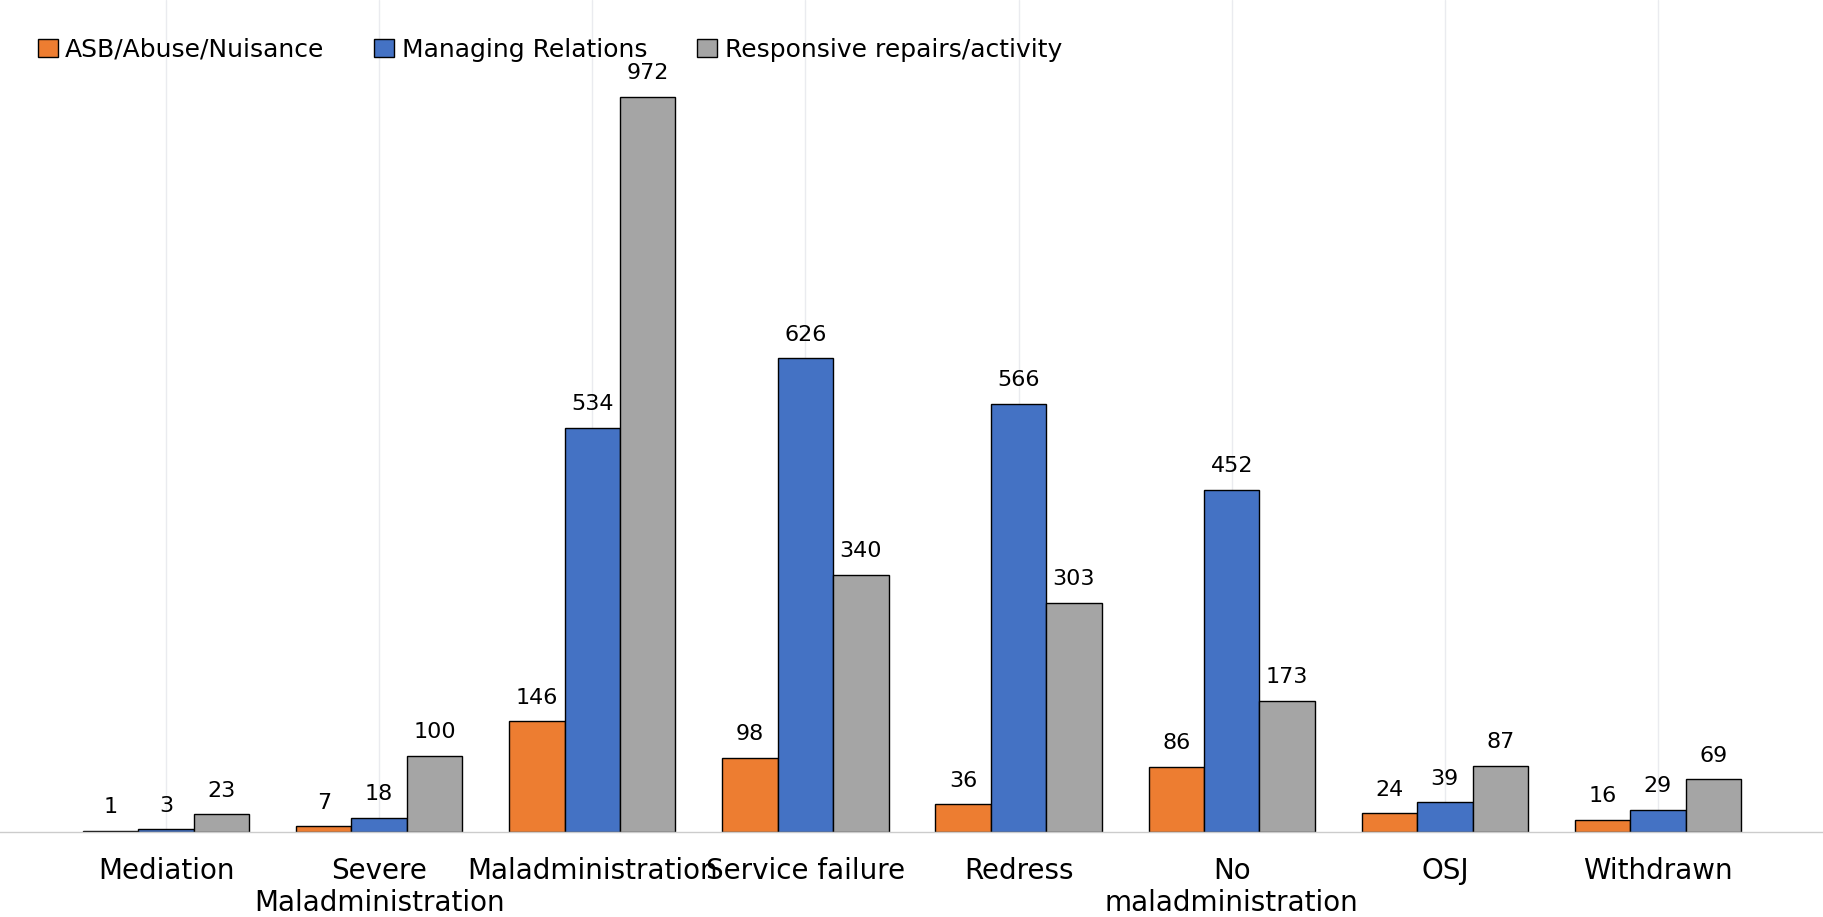
Grouped bar chart showing determination outcomes for three complaint categories: ASB/Abuse/Nuisance, Managing Relations, and Responsive repairs/activity. For Mediation, there were 1, 3, and 23 cases respectively. For Severe maladministration, there were 7, 18, and 100 cases. Maladministration was the most common outcome, with 146 ASB/Abuse/Nuisance cases, 534 Managing Relations cases, and 972 Responsive repairs/activity cases. Service failure accounted for 98, 626, and 340 cases respectively. Redress accounted for 36, 566, and 303 cases. No maladministration accounted for 86, 452, and 173 cases. Outside jurisdiction (OSJ) accounted for 24, 39, and 87 cases, while Withdrawn accounted for 16, 29, and 69 cases. Responsive repairs/activity had the highest number of maladministration findings, while Managing Relations had the highest number of service failure and redress outcomes.

Type of landlord

Grouped bar chart showing determination outcomes by landlord type: Housing Association, Local Authority/ALMO/TMO, and Other. Maladministration is the most common outcome, with 1,224 cases for Housing Associations, 638 for Local Authorities/ALMOs/TMOs, and 17 for Other landlords. Service failure accounts for 921, 340, and 13 cases respectively. Redress accounts for 854, 180, and 13 cases. No maladministration accounts for 653, 280, and 8 cases. Outside jurisdiction (OSJ) accounts for 225, 108, and 6 cases, while Withdrawn accounts for 114, 28, and 8 cases. Smaller outcomes include Severe maladministration with 85, 52, and 0 cases, and Mediation with 38, 8, and 0 cases respectively. Housing Associations have the highest number of cases across all determination outcomes.

Size of landlord

Grouped bar chart showing determination outcomes by landlord size: between 1,000 and 10,000 units, fewer than 1,000 units, and more than 10,000 units. Maladministration is the most common outcome across all landlord sizes, with 306 cases for landlords with 1,000 to 10,000 units, 46 cases for landlords with fewer than 1,000 units, and 1,527 cases for landlords with more than 10,000 units. Service failure accounts for 200, 40, and 1,034 cases respectively. Redress accounts for 117, 23, and 907 cases. No maladministration accounts for 178, 48, and 715 cases. Outside jurisdiction (OSJ) accounts for 76, 18, and 245 cases, while Withdrawn accounts for 22, 4, and 124 cases. Smaller outcomes include Severe maladministration with 15, 0, and 122 cases, and Mediation with 6, 0, and 40 cases respectively. Landlords with more than 10,000 units have the highest number of cases across all determination outcomes.

Orders and recommendations

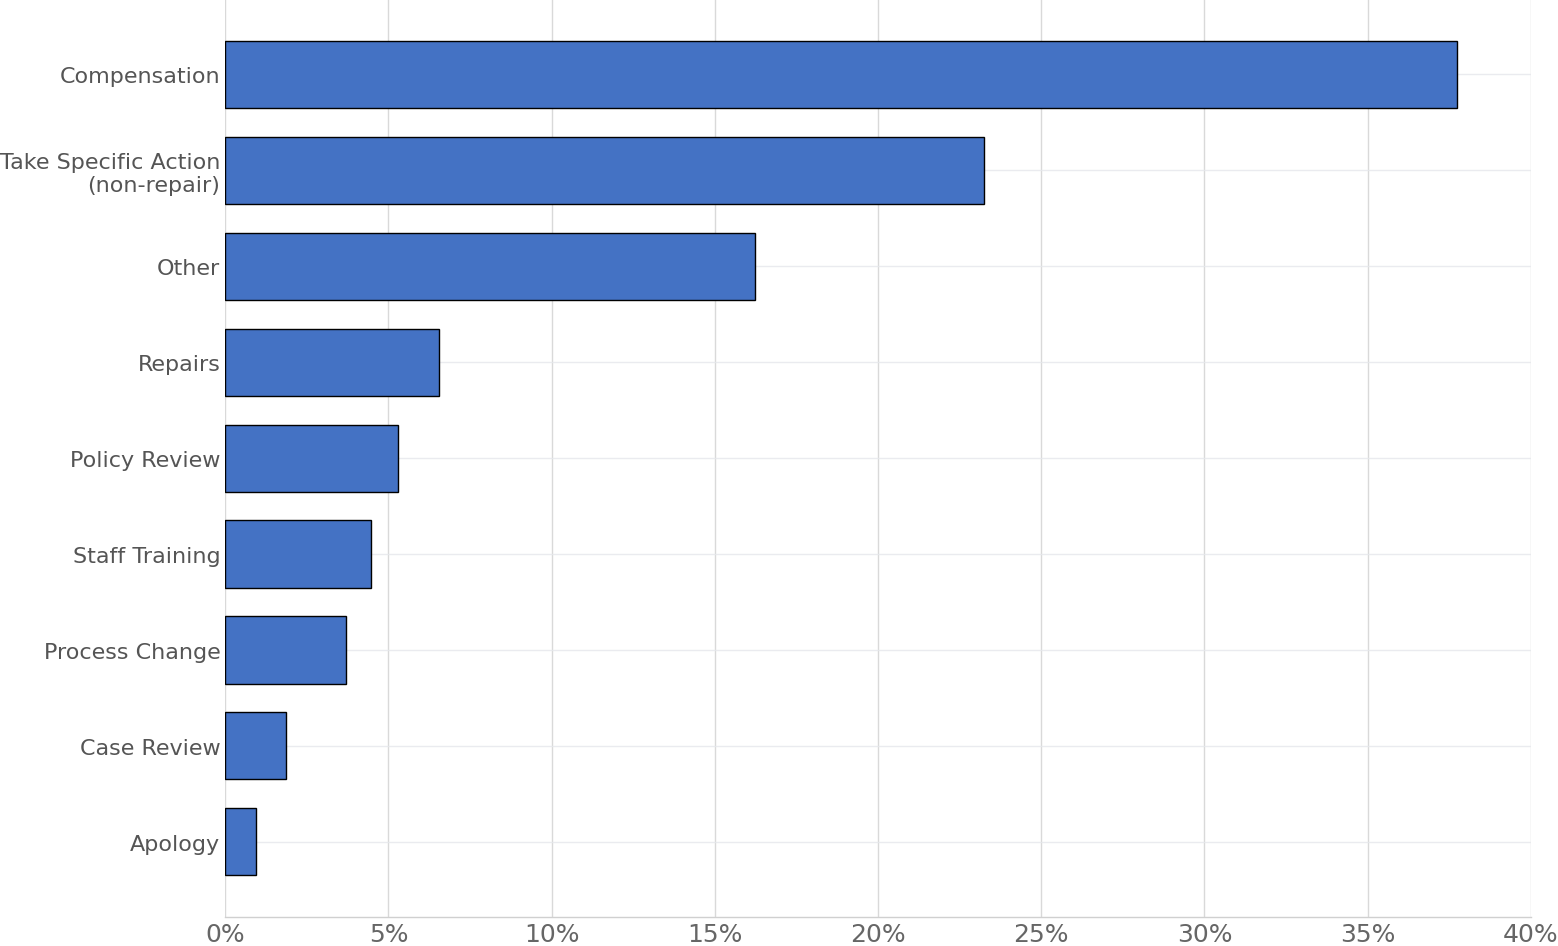
The orders given to landlords graph shows that in 47% of cases, we ordered landlords to pay residents compensation. And the recommendations given to landlord’s graph shows that in 23% of cases, we recommended that the landlord take non-specific action (usually something that is outside a repair).

The final graph shows how many orders and recommendations we’ve made based on the top 4 complaint categories.

Orders given to landlords
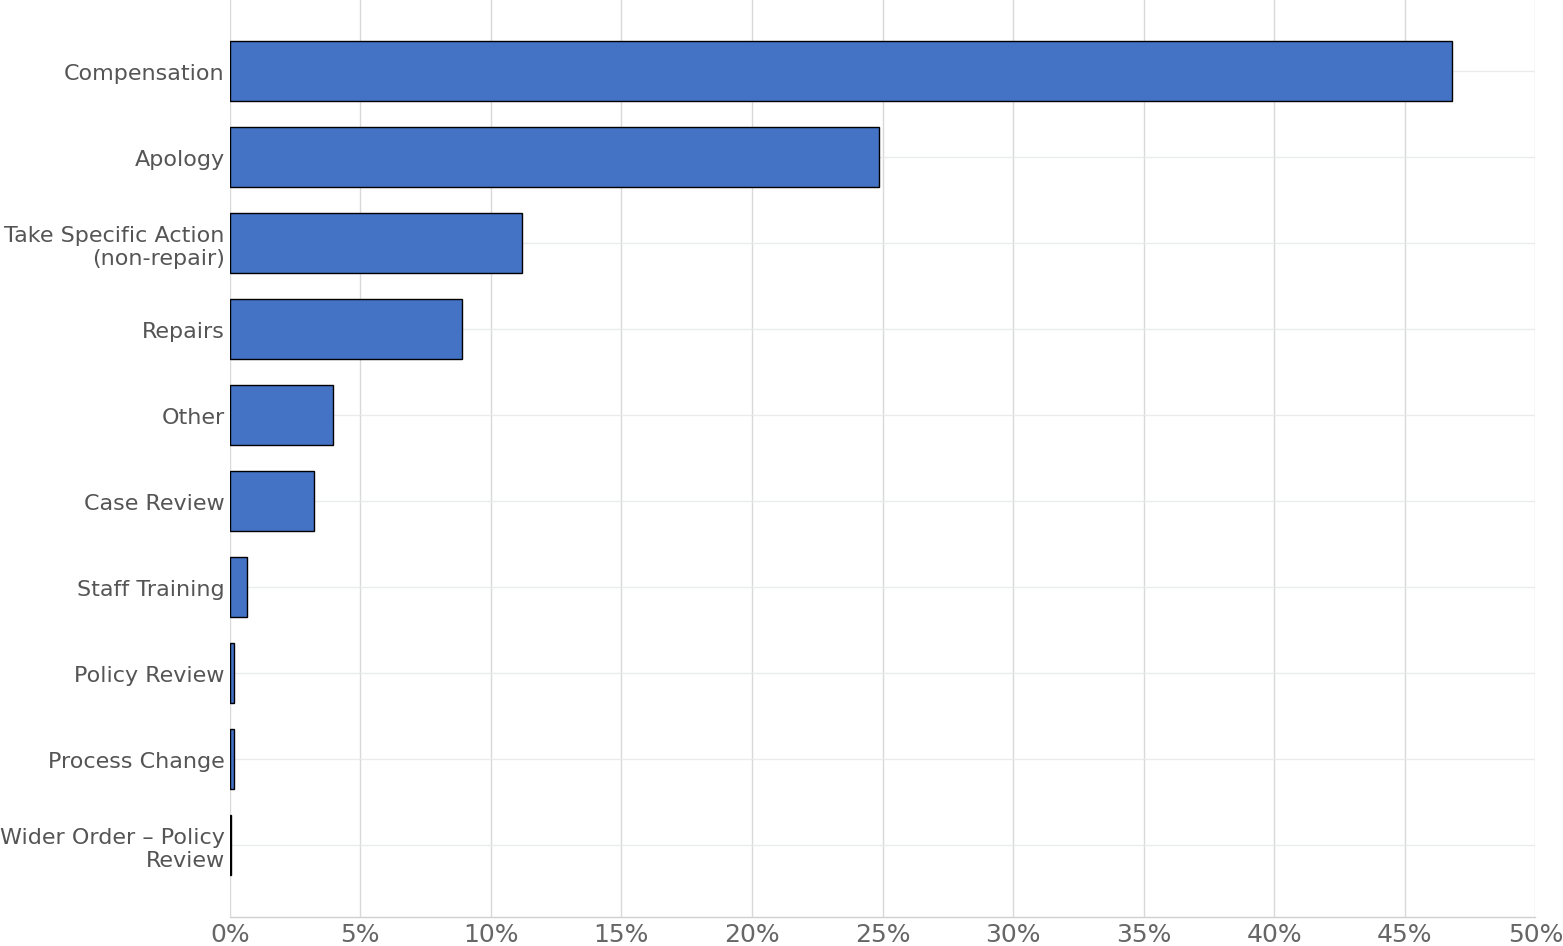
Horizontal bar chart showing the percentage of orders made by outcome type. Compensation is the most common order at 46.8%, followed by Apology at 25.0%. Take Specific Action (non-repair) accounts for 11.2% and Repairs for 8.9%. Smaller categories include Other at 3.9%, Case Review at 3.2%, Staff Training at 0.6%, Policy Review at 0.2%, Process Change at 0.2%, and Wider Order – Policy Review at 0.1%. Compensation and apologies make up the majority of all orders.

Recommendations given to landlords

Horizontal bar chart showing the percentage of recommendations made by outcome type. Compensation is the most common recommendation at 37.7%, followed by Take Specific Action (non-repair) at 23.3% and Other at 16.2%. Repairs account for 6.5% of recommendations. Smaller categories include Policy Review at 5.2%, Staff Training at 4.4%, Process Change at 3.7%, Case Review at 1.8%, and Apology at 0.9%. Compensation is the most frequently recommended action by a clear margin.

Orders and recommendations made against top 3 complaints
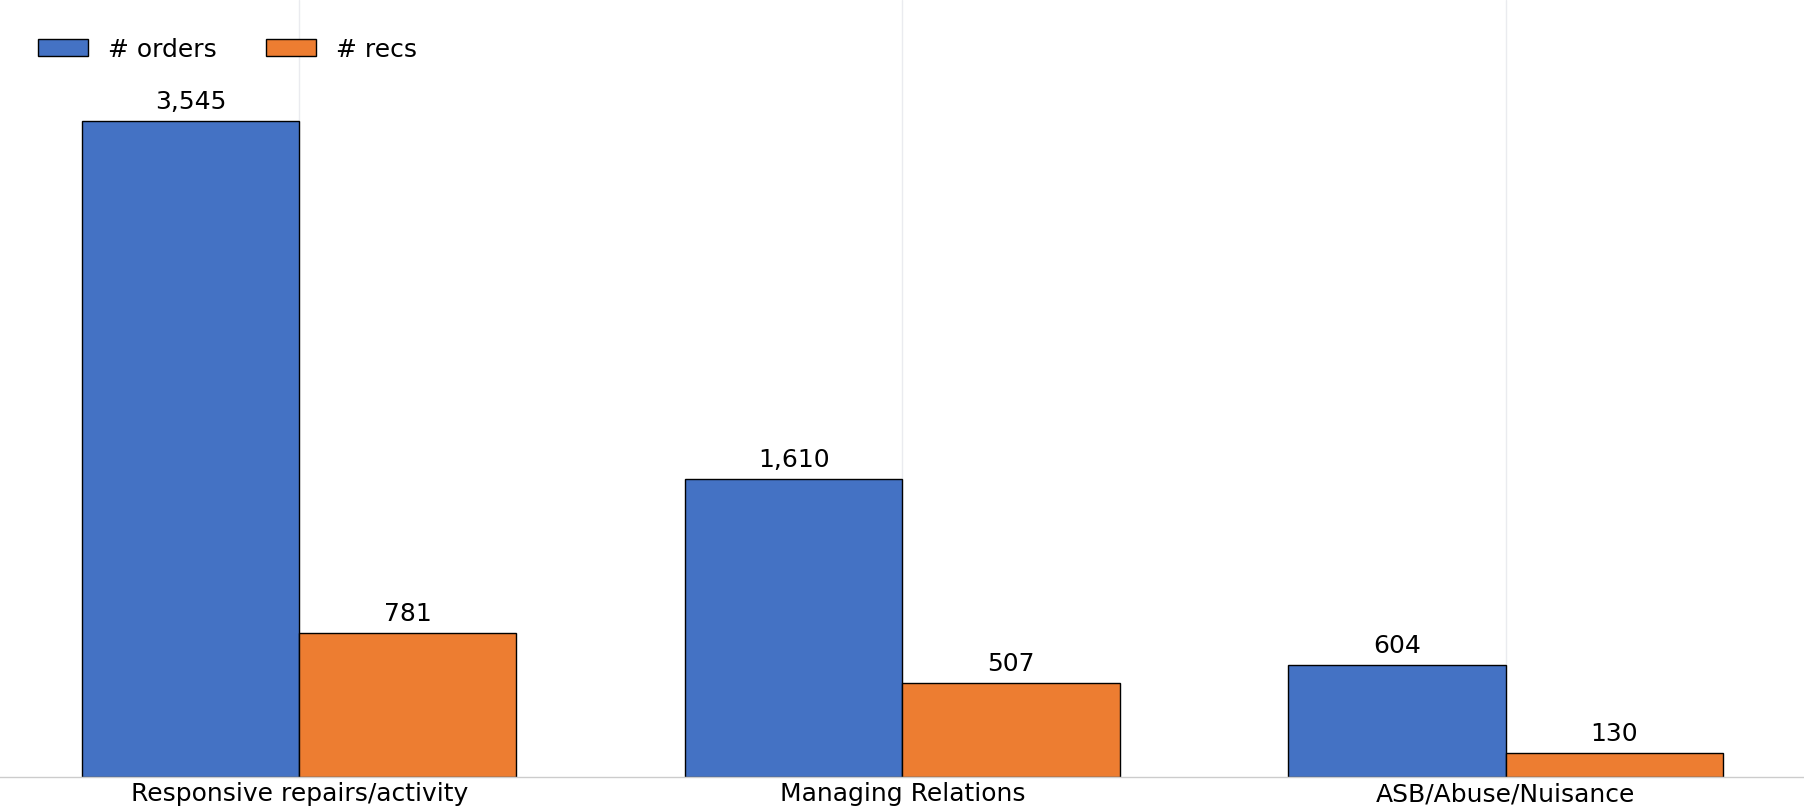
Grouped bar chart comparing the number of orders and recommendations across the three most common complaint categories. For Responsive repairs/activity, there were 3,545 orders and 781 recommendations. For Managing Relations, there were 1,610 orders and 507 recommendations. For ASB/Abuse/Nuisance, there were 604 orders and 130 recommendations. In all three categories, the number of orders exceeds the number of recommendations. Responsive repairs/activity has the highest number of both orders and recommendations.

* All data is provisional and subject to confirmation in the final end-year figures to be published in the annual report.

Please note that this data may be subject to change. The verified data that we publish on an annual basis in our Annual Complaints Review can be found online.